Steemit Crypto Academy | Homework Task 4 For @stream4u
Hi everyone, I have gone through the lecture of respected Professor @stream4u. This is an amazing lecture regarding technical analysis through use of technical indicators.

1. Support becomes Resistance & Resistance becomes Support.
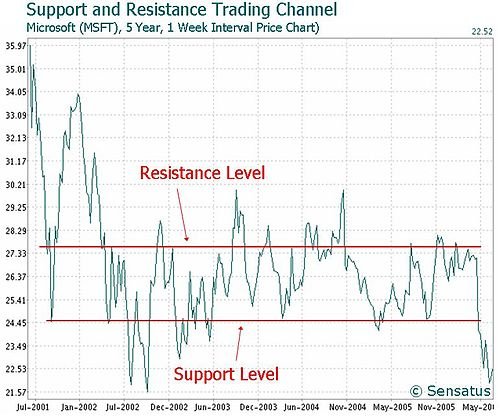
This is a great technical and famous point in trading world. I would like to explain it in my own words. As Support and Resistance topic has been discussed in detail in previous homework post, We discussed how to draw support and resistance on the candlestick chart. Now, let me explain how support becomes resistance and vice versa.
When the buyers are in control of market and they are taking asset price upwards, then a resistance line is broken to upward with more volume, in such case, the old resistance becomes new support for trading analysis purposes. This new support helps traders in entering the market with buy orders. We will discuss when and where to buy assets in the later part of the post.
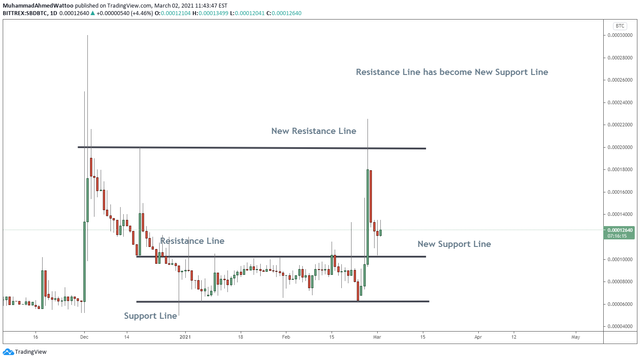
Resistance becomes Support
Likewise, when sellers are in complete control of the market, and market tends to go downwards, then a support level is broken to downward, in such case, broken support line will become new resistance line for the traders to consider.
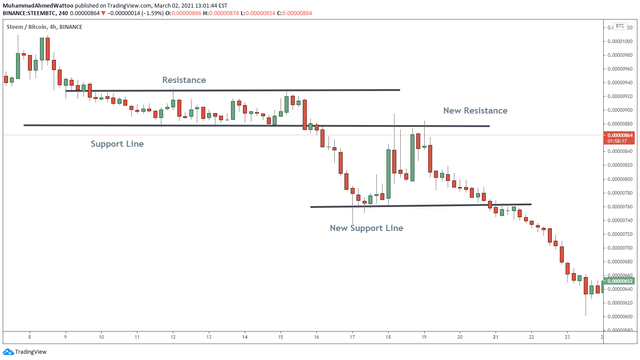
Support becomes Resistance
When and where to set buy trade.
As it is a one way trading in cryptocurrency trading, traders can only enter market by buying some asset and then exit trade by selling the asset. So we will discuss when and where to set buy trade to enter the market.
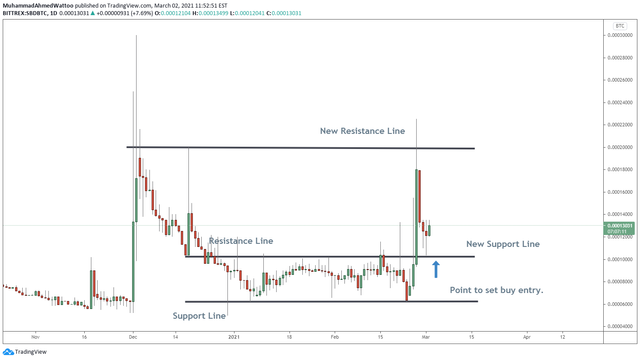
When and Where to set buy trade
As it can be seen in the picture above, I draw a support line and a resistance line. When the market is under buyers control and they took the market upwards, the resistance line is broken and market goes further upward. Now the broken resistance line is the new support level. Trader needs to enter the market buy setting buy trades on this support level. Trader has to draw new resistance line and wait for the market to come to new support line to enter the market by buying asset. This new support line is the point where to set the buy trade, and the previous support line will be the stoploss for this trade. This is how a trader can enter the market by buying asset.
2. What is Technical Indicator.
As the name itself tells us that a tool that indicates the trend of the market and also indicates the level to buy and sell, it can be termed as Technical Indicator. A technical indicator is developed on the basis of mathematical calculations and then coded in the form of indicators. Technical indicators help the traders to take a trade and exit the trade. There are too many indicators available in the market and every indicator has different method of its use. But every indicator is basically designed to help the traders to understand the market behavior and act accordingly. These indicators are a kind of facility for the traders.
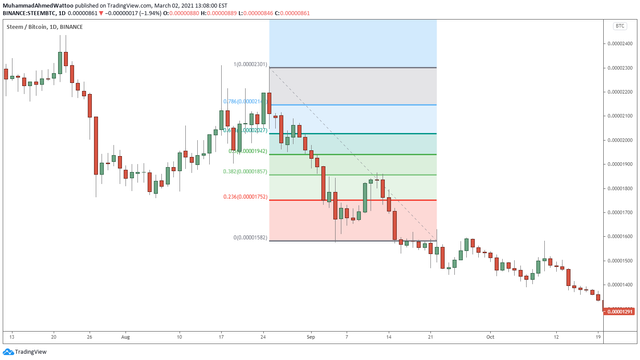
Fibonacci Retracement
In the above picture, I have used Fibonacci Retracement tool. It shows different level of retracement after a long leg upside or downside. I have tried to use this indicator and show you the results.
3. What is Trading View.
Trading view is a website and it is basically a platform where users all around the world share their ideas. Moreover, different exchanges have different prices of assets at the same time, and trading view provides with the facility of every exchange prices of different paired assets on one place. It is a very well designed platform and users can benefit from different ideas of different traders. One can also follow the traders he likes. Moreover, a user can select assets of his choice and will be notified whenever a trader shares idea regarding that asset. This process is called Wathchlist. A user with free account can also use this platform very easily. User can apply different indicators of his choice on the chart of any asset. So, this platform helps users to analyze the market in his own way and enter the market.
I have been using this platform for quite some time and I have also prepared my watchlist where I find good analysis of users I like. I suggest all of my readers to register on this platform and benefit from the opinions of many traders.
4. 200 Moving average.
Moving average refers to a term used for an indicators that helps in understanding the moving of asset price. This indicator can be used in different time frames. When a certain number is allotted to this moving average, this calculates the certain number of candlesticks of in that specific time frame and based on their average, it creates a line on the chart. This moving average line shows where the market is moving (Up or down). For example, 200 moving average is the average of past 200 candlesticks in the chart. If user has selected 1 day time frame, this moving average will be calculated on the basis of previous 200 days candlesticks. So, in this way, it will show the trend of that asset and that line of moving average will show the movement of the market price of that asset.
200 moving average is a very strong indicator and is used at large by traders to analyze the market. Now we will discuss its role in taking trades. How it indicates the movement of market.
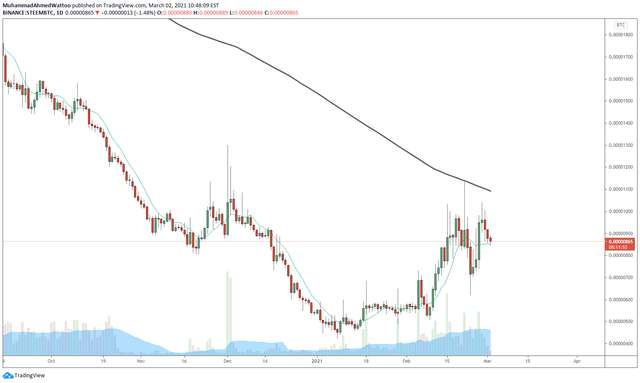
200 Moving Average Bearish
When market is bearish and sellers are in complete control, 200 moving average will show downward. In this scenario, market will remain under the line of 200 moving average. Whenever the market will take a pause and try to go upwards, it will touch this moving average line first. In case of bearish continue market, it will then go downwards further. When candlestick cannot break this line and closes under the line of this moving average, it indicates that price can go down further. On the other hand, when a candlestick crosses the line successfully and closes above this line, it indicates that the market can go up and signal the possible change in trend.
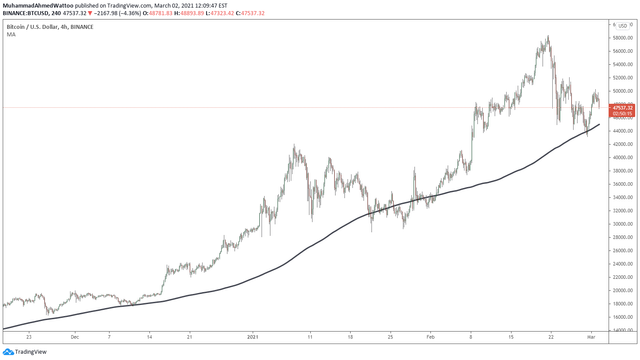
200 Moving Average bullish
When the market is bullish and buyers are in control of the market, the line of 200 moving average will move to the upside. Candlesticks will be above this line. In this case, whenever price tries to come near to this line or touches this line, but unable to cross this line, this indicates further increase in price and traders can enter the market by buying that asset. Similarly, when price comes to this line from upside and crosses the line of moving average, and successfully breaks the line by closing below this line, it indicates a fall in the price. So a trader can exit the market by selling the asset and avoid more loss. This moving average can help a lot and traders can analyze the market with the help of moving average.
This moving average line can help traders to set buy trade when it touches the line from upside and cannot cross the line. It will move up again and trader can take advantage of this trade. In this way, it can be helpful to the traders.
This is my homework week 4 for Professor @stream4u and I have tried my best to explain in a simple way. Any corrections or suggestions are welcome.
Thanks in anticipation.
Special thanks to @stream4u
Thank You

Cc:-
@steemitblog
@steemcurator01
@steemcurator02

Hi my friend ,
You have used the wrong tag ! Please correct it , otherwise relevant proff will miss the article.
Thank you
Thanks professor @besticofinder for that
And you are the best professor forever