Why RSI is the most effective technical indicator for trading/investing
Hi this is my first post on Steemit. Before I begin I would just like to mention that I have only been trading cryptocurrencies for about a month now, and that I am by no means an expert. I've had some experience trading options in the stock market in the past which I believe has helped me with some of my recent success in investing/trading cryptocurrencies.
OK so back on the topic...
There are many technical tools available for trading: Moving Averages, MACD, Bollinger Bands, Fibonacci, etc...
They're all great but sometimes they can also be a little bit complicated to use and analyze, especially if you're not that technically savvy.
So out of all the technical indicator tools, by far the best one (in my experience) is the Relative Strength Index or RSI.
I think its one of the most simplest and yet effective tools for trading.
We've all heard the saying, "Buy low, sell high".
Not as easy as it sounds....but that's exactly how you profit.
Anybody investing in cryptocurrencies (whether your timeline is daily, weekly, monthly, yearly, etc) would love to buy at the lowest price point possible, and turn around at some point to sell somewhere near the asset's peak value.

Luckily there is an awesome indicator that can significantly help an investor buy low and sell high, and that is the RSI.
Simply, an RSI chart tells you when an asset is overbought or oversold and to what degree. It has values that range from 0 to 100. Anything 30 or below is considered oversold, and anything 70 or higher is considered overbought.
An RSI chart normally has two horizontal lines that identify the 30 and 70 level. Now it always depends on the context, but in general the closer the value is to 30 or lower (the lower the better) it would be the best time to buy. In contrast, the ideal time to sell is when it is close to 70 or higher (the higher the better). Additionally an RSI chart normally has a default of 14 trading periods which it uses to calculate its RSI value.
Here are some examples of how I recently used the RSI to make good trading decisions in cryptos...
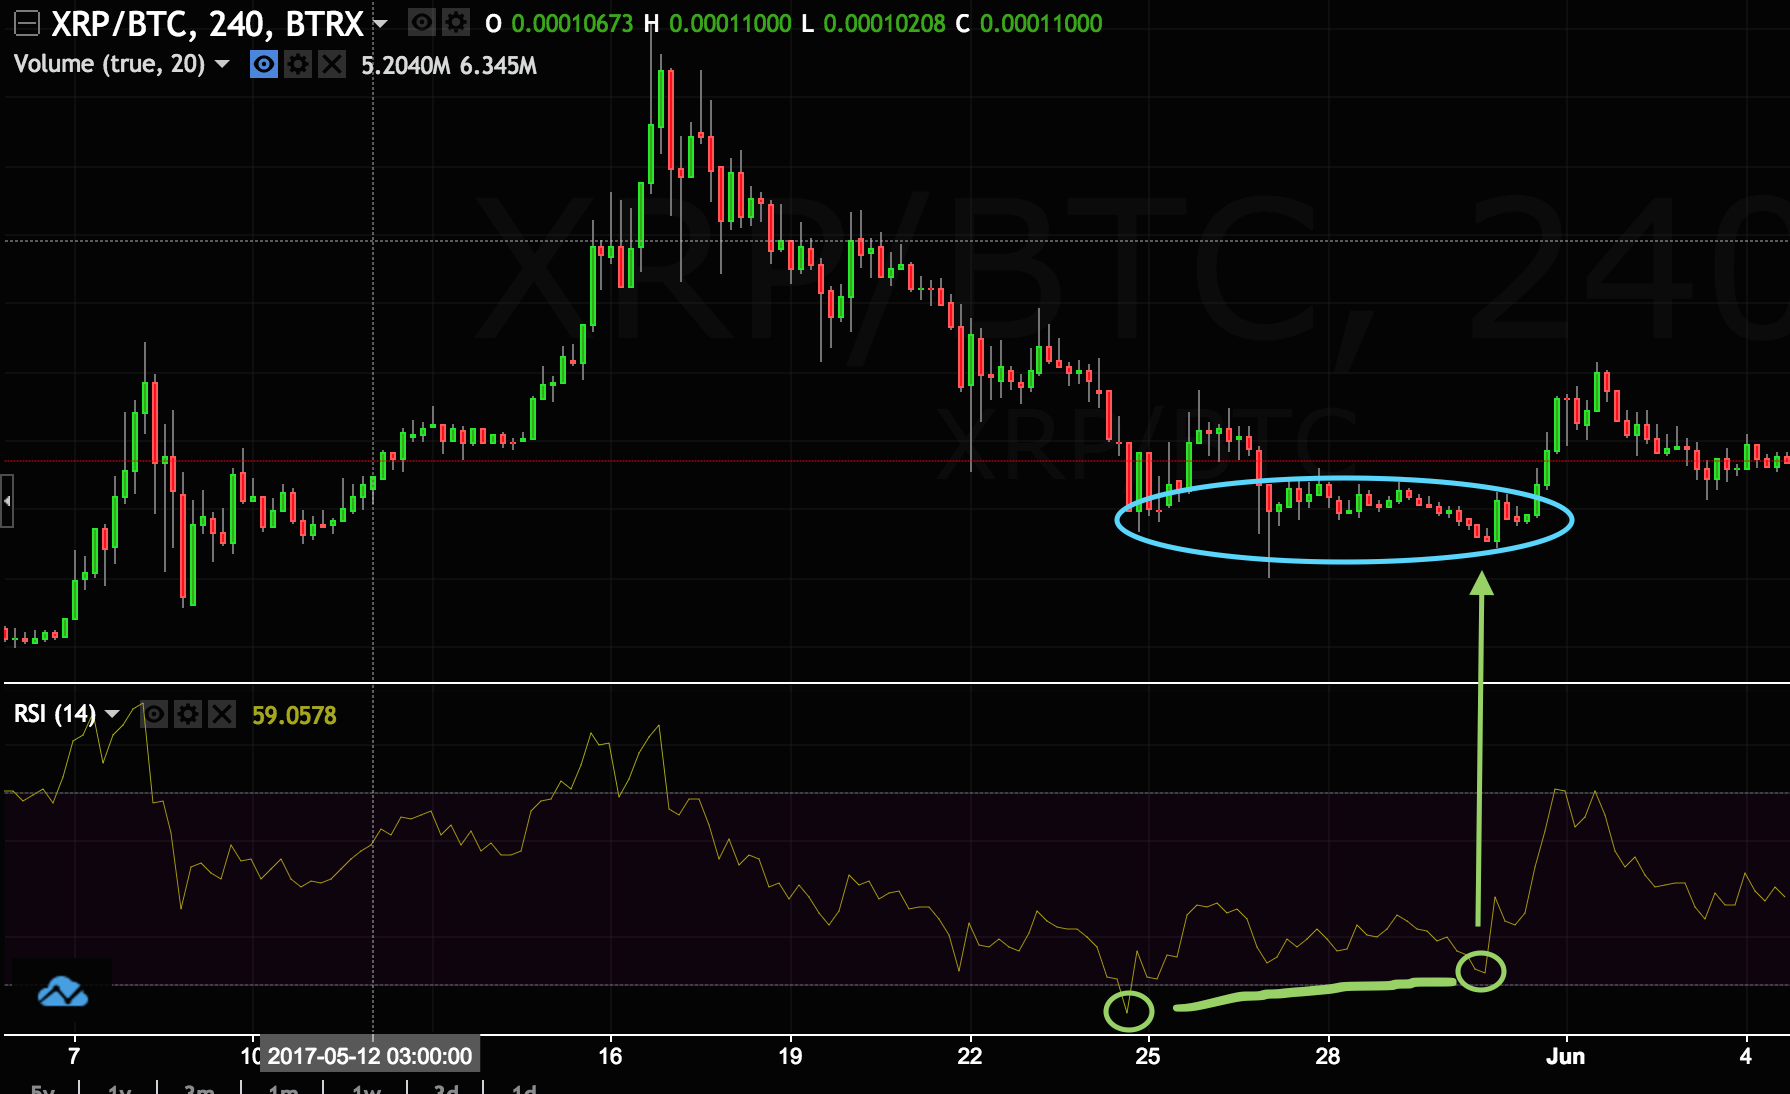
Below is a chart is a recent example of how I used RSI indicator for timing my purchase of Ripple (XRP). I was able to buy some Ripple on May 30 when it was at its support. Its RSI was close to 30 at the time I bought. I could have bought Ripple on May 25 when the RSI was actually lower than 30, but I wanted to wait until it bottomed out sideways to form a support and return to the 30 level again as a confirmation, which is what happened.

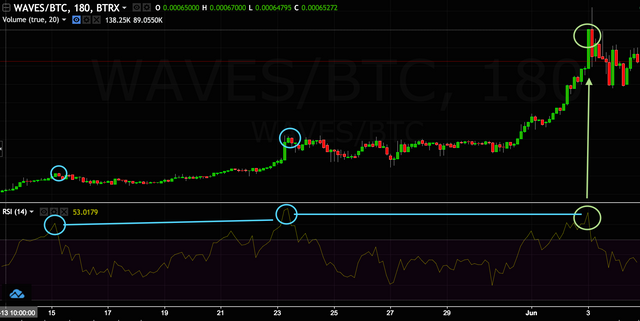
Here is an example of an RSI overvalued is when I sold my WAVES also on June 3 which I've held since it was one dollar. How did I know it was time to sell? I noticed the RSI reached 85 which was about on par as the previous major overbought period (around May 23). Additionally just by looking at its price chart, it was going parabolic which confirmed my decision to sell.

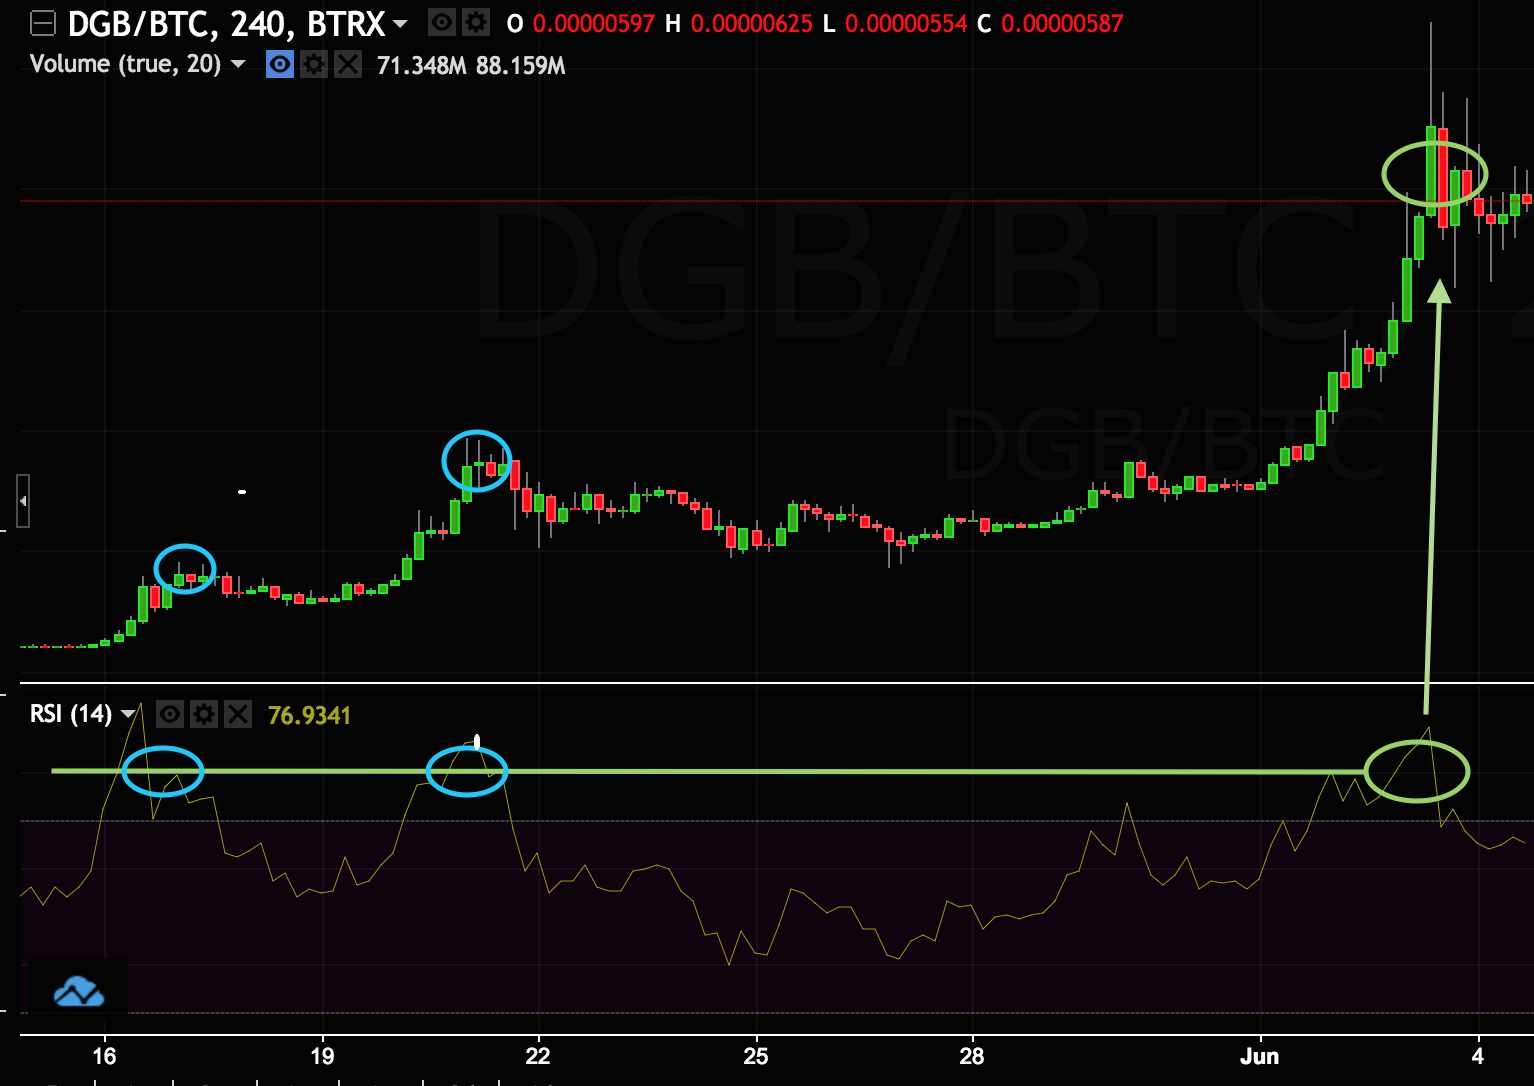
Here is another example of an RSI overvalued when I sold my Digiyte on June 3. I was lucky to buy it around 750 satoshis (~$0.018) a couple days before and sold it at 2000 satoshis (~$0.05). Digibyte peaked around 2500 satoshis ($0.065).
I sold it because the price chart was already looking parabolic and the RSI was over the 70 level. To confirm, the RSI actually reached near 90, which roughly matched the RSI levels of its last two overbought periods (May 17 and May 21).

As always, when using the RSI chart, I would always look at the whole context and not just blindly buy and sell when its at the 30 and 70 level. Being at the two ends doesn't always mean an automatic buy/sell signal. I would look at the price chart itself to see if it correlates with the RSI's level and also look at previous RSI overbought/oversold levels to see if there is a pattern or a redundancy that creates a support or resistance. For instance, has its price significantly gone up (maybe even parabolic) and rapidly in a short amount of time while at the same time the RSI's level is around 70 or higher, and matching previous overbought levels that correlates to peaks on the price chart? Those are some of the things I look for. RSI is just a tool and as with any tool it can be very useful if used the right way. There are other useful indicators besides the RSI, but if I had to choose only one, I strongly believe that RSI indicator gives me the most bang. Again I'm not an expert and this is all my opinion based on my experience. Anyways I hope this post can help other investors especially newbies make better decisions and timing when buying/selling cryptocurrencies. Cheers!
Source:
http://www.investopedia.com/terms/r/rsi.asp
https://www.coinigy.com
Congratulations @adriancabal! You have completed some achievement on Steemit and have been rewarded with new badge(s) :
Click on any badge to view your own Board of Honnor on SteemitBoard.
For more information about SteemitBoard, click here
If you no longer want to receive notifications, reply to this comment with the word
STOPIf you want to support the SteemitBoard project, your upvote for this notification is welcome!
Congratulations @adriancabal! You received a personal award!
You can view your badges on your Steem Board and compare to others on the Steem Ranking
Do not miss the last post from @steemitboard:
Vote for @Steemitboard as a witness to get one more award and increased upvotes!