Update On BITCOIN: Are The Whales Anticipating The End Of The Bearish Cycle?
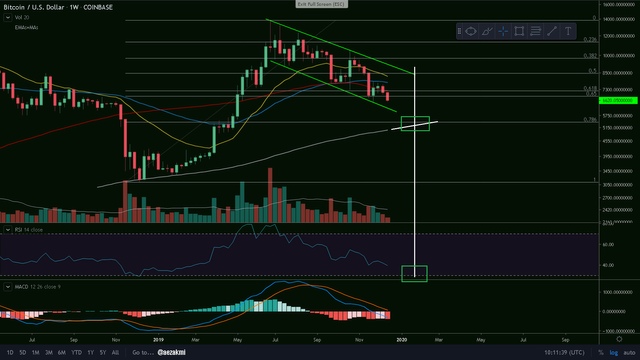
BTC/USD Weekly Chart
With our most recent drop, we broke again the Fibonacci Golden Pocket support (0.618 - 0.65, Fib. on the whole 2019 movement) level and continue our downtrend in the descending channel. As I stated in my previous posts, I still believe that we're going to revisit the 200w MA, currently at ~5000$. I'll be looking to enter a long position on BTC when reaching the green rectangle area: the price approaching the 200 weekly MA and the RSI bouncing at the lower reference line or even enter the oversold area, like in 2014.
Ctrl + Click here to enlarge the image in a new tab (steemitimages)

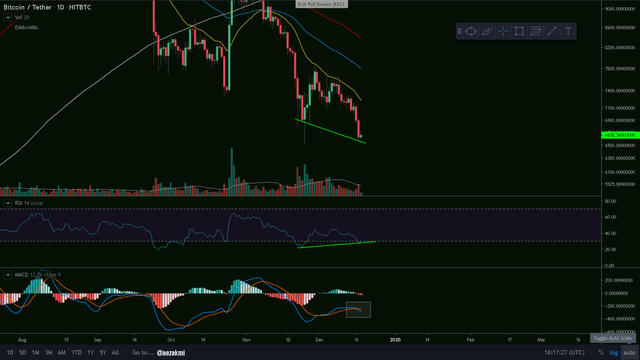
BTC/USD Daily Chart
On the daily we have a bullish RSI divergence and could see a short term bounce toward the 21 day EMA - yellow (~7200$). However, the MACD indicates a bearish cross and the bulls don't seem to have too much strength these days. For now, it look like the bears will close this year too.
Ctrl + Click here to enlarge the image in a new tab (steemitimages)

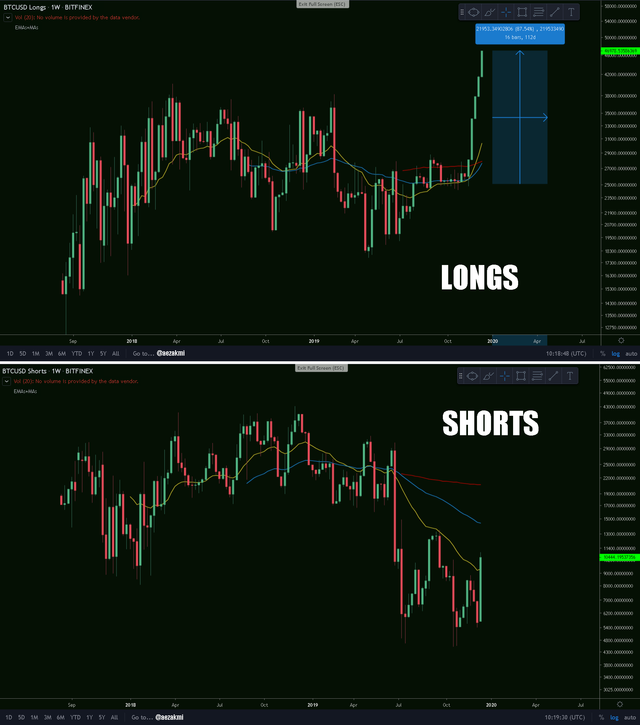
BTC - Shorts vs. Longs
....and now to the strange part. It seems that the 'Long' contracts on Bitcoin are soaring this period, reaching all time highs. The 'Shorts' are also increasing, responding to the current market, which is quite common - but under no circumstances like the Longs do. What's going on? Is it the whales anticipating a huge spike in Bitcoin's price?
In my opinion, we are indeed approaching the end of this bearish cycle and people are getting early on-board for the next cataclysmic rally.
Ctrl + Click here to enlarge the image in a new tab (steemitimages)


Thanks for reading and safe trading!✌
If you find this post useful, please:

@tipu curate :)
Upvoted 👌 (Mana: 0/20 - need recharge?)
Thank you for the support, @cardboard!
Here's our short term bounce:
Ctrl + Click here to enlarge the image in a new tab (steemitimages)