Confluence Trading - Crypto Academy / S5W6- Homework Post for @reminiscence01
With the high uncertainty levels of trading cryptocurrencies, a lot of systems have been evolved by traders to be able to navigate the market.
Most of these trading systems are programed so that there could be profitability and losses are reduced to minimum. It is great to learn more about confluence trading as taught by Prof. @reminiscence01. Great lesson. I will go ahead to drop my assignment input below.

Explain Confluence trading. Explain how a trade setup can be enhanced using confluence trading.
Taken from Meta Trader 4 app.
Crytopcurrency trading is about developing strategies based on the behavior of an asset price over time to help a trader determine what direction the price would subsequently be moving at and at what point he should open a position. Two key basis for taking a trade is knowing what trend the market is in and is going to follow and where is better suited for the trade to be taken.
To do this, many trader apply a number of technical analysis tools like indicators chart patterns and price action data. Any of this is capable of guiding a trader to take a trade.
Confluence trading comes in at this point. With the high volatility of the crytopcurrency market, a trader might want to get so assurances or greater probability before taking a trade. So, when a trader uses more than one trading tool to get signals and confirm the market situation before taking a trade, that is confluence trading. It refers to the use of more than one technical analysis tool to assess a trading set up and make confirmations.
How to Enhance Trading Setup
A trade setup can be enhances by confluence trading by taking information from the different tools to decide on a trade. When the different sources of information align in agreement, a trader has greater probability of winning the trade. When the different tools are in disparity, then a trader should refrain from taking the trade as there is no agreement meaning the chances of winning the trade are slimmer.
By the agreement of the tools, a trading setup is given more validation and and by the disagreement between the tools, a trading setup is invalidated.
Explain the importance of confluence trading in the crypto market?
As stated above, it is already evident that the risk level in operating the crytopcurrency market is quite high. There is a lot of volatility and abruptness in trend reversal and market condition changes. Thus, having a means of getting some level of certainty is surely a welcome development. The specific importance and advantages of confluence trading include:
A trader has more solid basis to either open, exit nor suspend opening a position. It gives more reasons for taking a particular trading decision.
Detecting entry and exit points is much easier when using confluence trading.
The probability of winning a trade is increased when a situation of agreement is reached using confluence trading. A trader will have more likelihood to win a trade if he operates on confluence trading as all the signals from different tools point to the same outcome.
There is opportunity of detecting market manipulation and fake signals. A trader will rarely fall prey to the tricks of big market players who try to influence the market in their favour.
A trader will stand lower chances of losing his capital as he is exposed to lesser risk and operates based on confirmations.
Explain 2-level and 3-level confirmation confluence trading using any crypto chart.
Depending in the number of technical analysis tools used by a trading in confluence trading, the system can either be tagged a 2-level or a 3-level system.
2-Level Confirmation Confluence Trading
This is a trading system where a trader takes trading decisions based on the signals he receives from two different trading and technical analysis tools. It is a combination of two strategies to confirm trades. Here, a trader depends on the agreement or variance of the signals from two tools take a trade or refrain from a trade.
To demonstrate these two confluence trading systems, I will make use of a combination of resistance level, Stochastic Oscillator, Bollinger Band, Average Directional Index (ADX).
I will be using a resistance level represented by the yellow horizontal line.
ADX line going above the 50 mark shows that the current trend whether up or down is a very strong one. When the line goes below the 50 mark, it shows it is not a very strong trend.
The Bollinger Band has 3 bands, the upper, middle and lower bands. Price crossing the middle band indicates a reversal from the direction where it is coming from to the other where it is going. For instance, if the price is crossing from the upper band towards the lower band, it she's that the trend is changing from an uptrend to a down trend and vice versa. Price staying at one end of the band for a prolonged duration shows a strong trend.
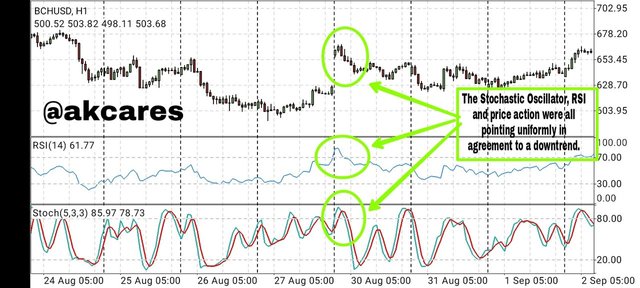
The Stochastic oscillator shows area of overbought and oversold which implies that when price enters this regions it is very likely that that will reverse in the opposite direction.
I will demonstrate this with a chart of NEO/USDT
I will be using Stochastic Oscillator and Bollinger Bands.
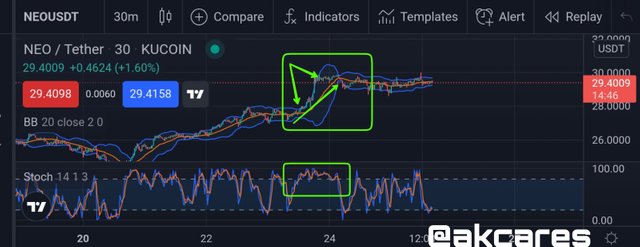
I this case the marked portion showed a persistent uptrend as the price clinged to the upper band of the Bollinger indicator.
The Stochastic Oscillator supports this strong bullish trend with the lines remaining in the overbought region for a long time. These two technical analysis tools both pointed to there being a strong uptrend.
3-Level Confirmation Confluence Trading
In this confluence trading system, a trader employs three separate techniques or technical analysis tools to draw signals for trade. These could be combination of different indicators, charts patterns or price action.
When trading conditions from the three chosen tools align, the trader gets confirmation to launch a trade, of they do not align, the trader does not take a trade.
- I want to first use the chart of AVAX/USDT to illustrate this.
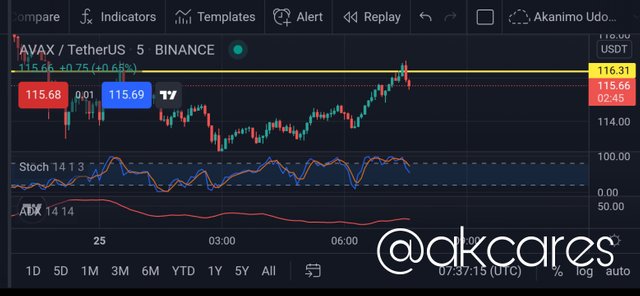
The resistance level is drawn at a region where price had reversed repeatedly in the past when it rose to that point.
The average directional index line was below the 50 point mark which shows that the trend was not a strong one as 50 mark and above indicates strong trend. This relatively weak trend indicated that the trend lacked momentum to continuen I its present condition and might soon reverse.
The 3-level confluence here is shown by the price reversing at the resistance level.
The Stochastic oscillator is in the overbought region meaning it should reverse downwards and the ADX line is below 50 mark which shows that the trend is not strong and is susceptible to reversal.
- A second 3-level confluence is the shown in this market price chart of LUNA/USDT.
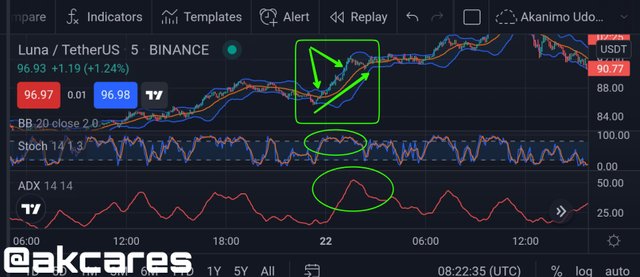
Here, Bollinger Band, Stochastic Oscillator and Average Directional Index are used.
In this chart, we find the price aligning to the upper band. This is an indication that the up uptrend was strong.
On the Stochastic Oscillator, we see the price persisting in the overbought region for some time. The average directional index has its line above the 50 point mark, indicating the same strong uptrend.
Analyze and Open a demo trade on two crypto asset pairs using confluence trading. The following are expected in this question. a) Identify the trend. b) Explain the strategies/trading tools for your confluence. c) What are the different signals observed on the chart?
First Demo Trade
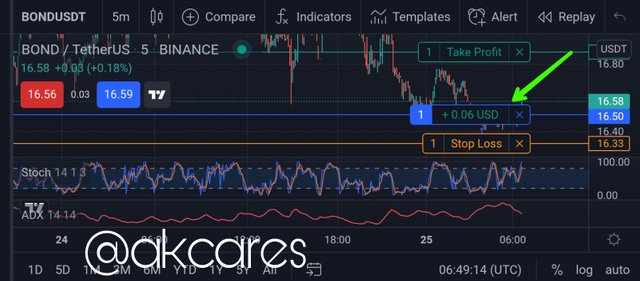
I will be taking a trade on the pair of BOND/USDT.
The market was on a downtrend. It was obeying the bearish market structure making lower highs and lower lows until at a point it failed to go lower than the previous low but the price started turning upwards. This signalled a potential reversal of the initial downtrend.
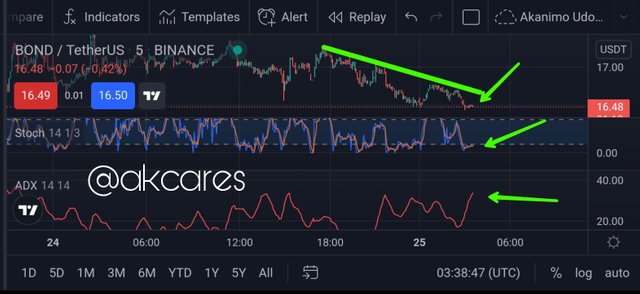
The Stochastic oscillator line was down in the over sold region. Being in this region signals that the trend might soon reverse.
Also, the average directional index line was below the 50 point mark which shows that the trend was not a strong one as 50 mark and above indicates strong trend. This relatively weak trend indicated that the trend lacked momentum to continuen I its present condition and might soon reverse.
At this point, I decided to go for a long trade. I placed the entry point at the end of the second bullish candlestick.
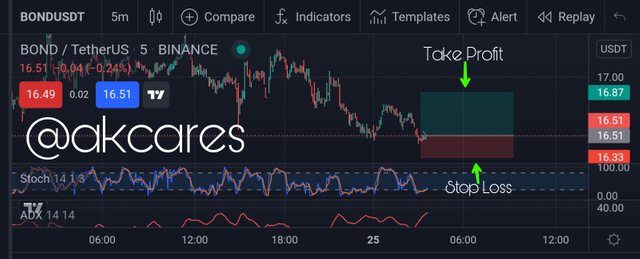
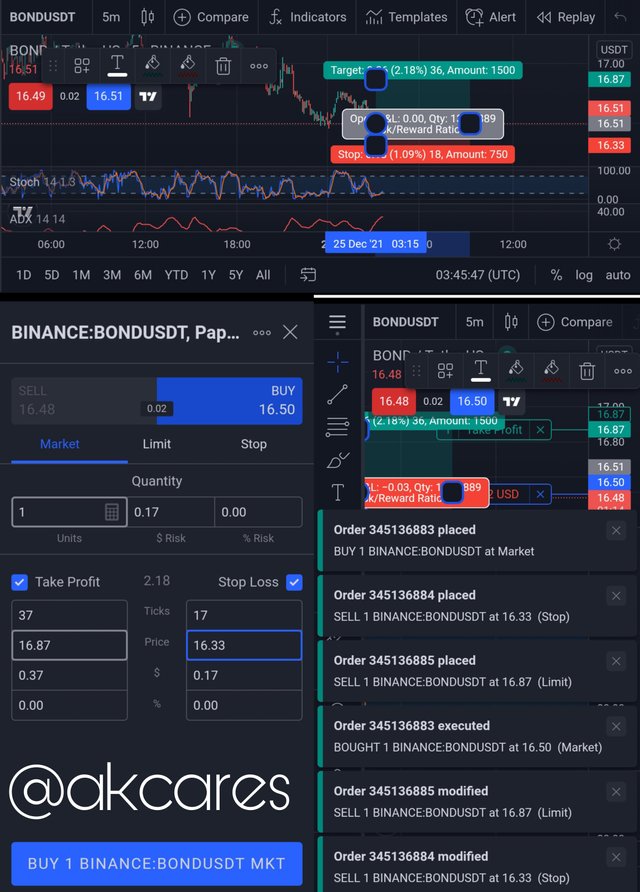
The take profit to stop loss ratio was placed at 2:1 with the take profit being at 2.18% from the entry point and the stop loss at 1.09% from the entry point.
The trade appeared to be going well after a while.
Second Demo Trade
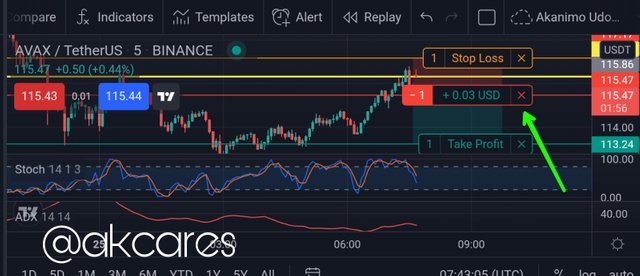
I will be taking a trade on the pair of AVAX/USDT.
The market was on an uptrend. It was obeying the bullish market structure making higher highs and higher lows until at a point it reached the resistance level marked by the yellow horizontal line. Here the price started turning downwards. This signalled a potential reversal of the initial uptrend.
The Stochastic oscillator line was up in the over bought region. Being in this region signals that the trend might soon reverse and it was already showing signs of reversal.
Also, the average directional index line was below the 50 point mark which shows that the trend was not a strong one as 50 mark and above indicates strong trend. This relatively weak trend indicated that the trend lacked momentum to continuen I its present condition and might soon reverse.
At this point, I decided to go for a short trade. I placed the entry point at the end of the second bearish candlestick. The take profit to stop loss ratio was placed at 2:1 with the take profit being at 2.26% from the entry point and the stop loss at 1.13% from the entry point.
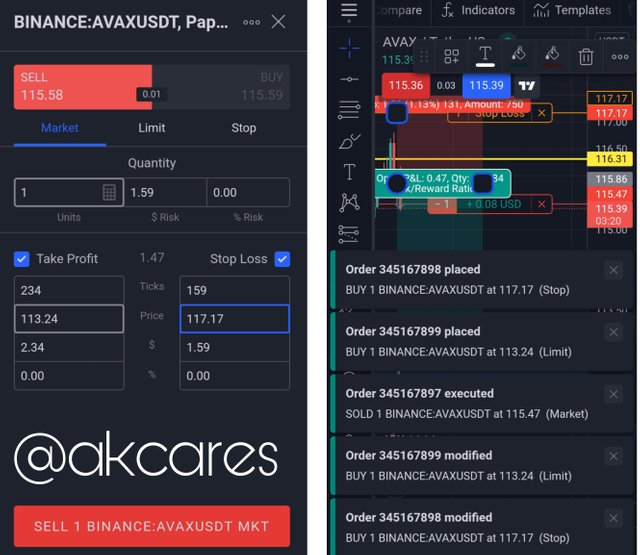
The trade appeared to be going well after a while as it was in profit.
All Screenshots were taken from Trading view
Is it true that one may not achieve much in life as well as in trading if he does not take risks. It is by taking risks that a opportunities are turned to success stories. Yet, there is a great need for care while taking risks. It is something called calculated risks. With this, we can tell when and go what extent we should take chances.
It is true that the crytopcurrency market does not give any promises. Infact the only promise that if one is not careful all his capital can vanish in just a little passage of time. Thus, we see the practice of confluence trading being adopted by informed traders. This trading style has great advantages and importance.
It makes traders to be able to deal with the high volatility and price fluctuations in the market. A trader can choose to use any number of trading tools to get multiple confirmations. It is advised that a trader use those tools he can comfortably apply and interpret and also avoid bringing in too many things to avoid the chart being over-crowded which will make it difficult to read and may bring confusion.
Hello @akcares , I’m glad you participated in the 6th week Season 5 of the Beginner’s class at the Steemit Crypto Academy. Your grades in this task are as follows:
Recommendation / Feedback:
Thank you for participating in this homework task.
Hello @akcares,
The minimum requirement to participate in the steemit crypto academy is 150 Steem. Your powerup is below 150 thus you're not eligible.
Hello Prof. @reminiscence01
I am sorry for the oversight. Did not quite understand the rules.
I have added additional power up.
Pls kindly grade my post.