Crypto Trading with Moving Average -Steemit Crypto Academy | S6W2 | Homework Post for @shemul21
It is nice to be here once again to participate in another Steemit Crytop Academy week with a brand new professor. I am looking forward to attending more of your classes and taking on the assignments. This particular lesson about moving average indicators has delved deeper to reveal some really interesting facts to me. I will go now on to handle the assignment questions for the week.
Explain Your Understanding of Moving Average
Moving average is one of the numerous tools used in technical analysis. It is a type of technical indicator. It is calculated using previous price data of a certain period and determining the average.
The indicator uses information of specific previous candlesticks to produce an average which signals the predominant behavior of the asset price during that period. The strength of the moving average is that it removes noise by ignoring the impacts of random, short-term fluctuations on the price of a cryptocurrency during the time period.
Moving average helps to simplify price data by giving a constantly updated average price. Moving average is classified as a lagging, trend-following indicator since the signal it produces is based on previous price points.
Moving average can also be used to determine trend direction of an asset and also mark out key price zones like support and resistance levels. It is a very practical and flexible indicator of use and it can be adapted to a number of functions.
What creates the adaptability of a moving average is that it can be adjusted to fit and give data of the specific period of time that that trader is interested in. A trader who wishes to draw his observation from the past 100 days period will use a 100-day moving average.
A trader who wants to base his observation on a shorter length of time can choose a 10-day or 20-day moving average. Since moving average is a lagging indicator, the longer the review period, the more the lag in response and signal.
What Are The Different Types of Moving Average? Differentiate Between Them.
Moving average indicators have some variations. These different variations are obtained as a function of the method of their calculation. This means, the total information used in calculating the moving averages differ. Some take more data points into consideration while some take less.
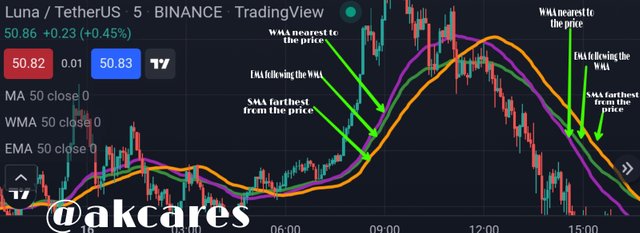
Generally, there are two very popular types of moving averages, the simple and the exponential moving averages (SMA and EMA). However there is yet another type known as the Weighted Moving Average.
- Simple Moving Average
Simple Moving Average has the formula: (A1 + A2 +...+An) / n
This is a straightforward calculation of the average price of an asset over a period of time. It is the basic form of moving average as it does not involve complex permutations but just a simple computation of the average value of an asset.
In the formula above, A = Average price data
n = Number of periods used. This means that if the moving average is to be taken for the last 20 days, then the average price of the asset for the past 20 days will be used to calculate. That will be (A1+ A2+A3+A4... A20)/20
- Exponential Moving Average
As I had already stated, the moving average is a trend following indicator. This implies that that signal and movement of the indicator line occurs after the actual price movement of the asset has been completed.
Thus, to make the moving average more responsive and real-time, to the price data that is more current is given higher weight in calculation to get the exponential moving average.
Exponential moving average has the formula: [ Cp × (s/1+n)] + EMAp × [1 - (s/1 + n)]. Here, Cp represents the current price. s represents the smoothing factor. n stands for the period in consideration or the number of days.
EMA helps to trace and identify trends just as the SMA. The advantage of the EMA over SMA is that it is more indicative of the actual situation of the market in real time and it changes more with alterations in price.
This characteristic of EMA makes it highly suited for short duration trading regimes and scalpers tend to benefit more from it as it signals trend reversals and price change.
To obtain information about how an asset is performing both over an extended period and over a shorter period, a combination of simple moving average and exponential moving average.
- Weighted Moving Average (WMA)
Just as the name implies, the Weighted Moving Average has the additional procedure of attaching more weight to recent data points while previous data points are assigned lower weights. The weight distribution is done in such a way that the price data are multiplied using a stated coefficient with all the multiples summing up to 100 percent or 1.
The concept of operation of this type of moving average is that it pays more attention to most recent prices than the past ones. This is a move to keep in line the actual state of the market.
To obtain the WMA, the formula below is used:
WMA = (Price1 × n + Price2 × (n-1) +...Pricen)/ [ n × (n+1)/2]
n = Period(number of days)
From the explanation of the three types of moving averages and from the formula used to calculate each one, we can observe certain disparities and changes in the model.
Accordingly, these different types contrast with one another. We will now look at these distinguishing features.
| SMA | EMA | WMA |
|---|---|---|
| SMA is computed with the average price of an asset for a certain period | EMA is computed with the current price and a multiplier value | WMA considers the most recent price data point and makes the previous data point less significant |
| It is more fitted for long term trading regime because of using average price points | EMA makes it easier to spot trend reversals and it shows more details about price behavior this makes it better suited for short trading regimes | Scalping is more supported with EMA as the indicator is more responsive to changes in prices and its signal is more up to date. |
| The lag is SMA is very pronounced and way behind the actual price action | EMA follows price action more closely and had lower reaction time | This is the most reactive of all the moving averages. It follows the price movement almost immediately. |
| Longer period of calculation produces higher probability results as more information is being taken into consideration | Attention is on more recent price data and more reliable information is gotten from shorter period | The model builds higher probability into the calculation irrespective of the length of the period used. |
Identify Entry and Exit Points Using Moving Average. (Demonstrate with Screenshots)
Moving average indicator is key and very dependable in marking out market exit and entry points. This can be illustrated using some examples. I am also going to make use of the dynamic support and resistance levels that moving averages provide in the chart.
I will be using the 100 period simple moving average and the 50 period exponential moving average. The 100 period simple moving average which gives the average of the price for the past 100 day period, is to serve as a trend detection signal as it shows the general direction of the market.
The 50 EMA is our guide to determine when and where to open or close a trading position as it is very indicative and sensitive to quick price movements while showing what the situation in the market is.
To more correctly identify trading and closing entries, there are two concepts of moving average indicator that needs to be considered. These are:
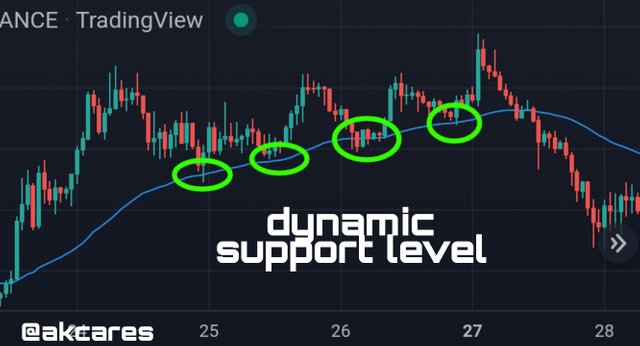
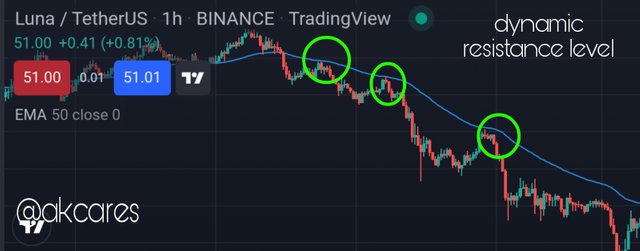
- Dynamic Support and Resistance Level
The indicator line acts as a reference level when it has interacted with the price more than two times and has repelled the price in the opposite direction.
The ability of moving averages to act as reference level is shown when the price of an asset on retracement either in a strong downtrend or uptrend bounces off the indicator line and reverses in the original direction of the trend.
- Dictation of Trend and Market Direction
Moving average is one simple way of detecting what the trend is and who has control of the market.
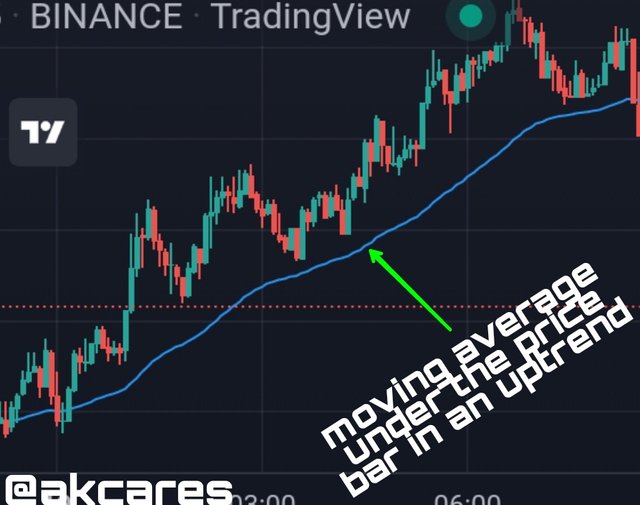
In a price chart, when the price bars are higher than the moving average line, this shows that there are more buying pressures and the price of the asset is likely going to keep rising. It shows a bullish situation with buying opportunities.
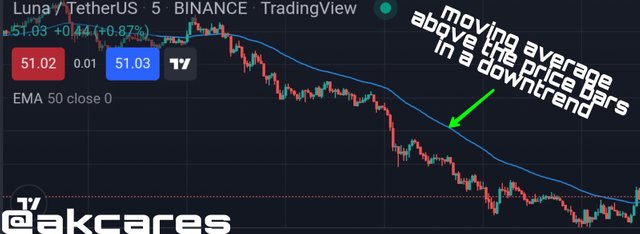
When the moving average is hovering over the price chart, then it means that there are more selling pressures and that the sellers are in control. The price of the asset will most likely keep dropping indicating selling opportunities.
I will use some charts to clearly illustrate this entry and exit conditions.
- Bearish Trade
This is a chart of Sol/Tether USD
To take a sell trade, the trend must be moving downward as seen here. This is supported by the fact that the moving average is above the price bars.
This shows that the price is on a fall and that sellers are in control of the market. During this period, price is also unable to break above the moving average line which makes it a resistance level.
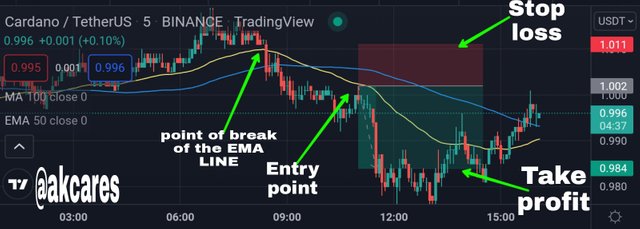
The trade entry is signaled by the fast moving average. This happens when the price retraces up briefly. It gets to the EMA 20 line and bounces back in the direction of the original trend.
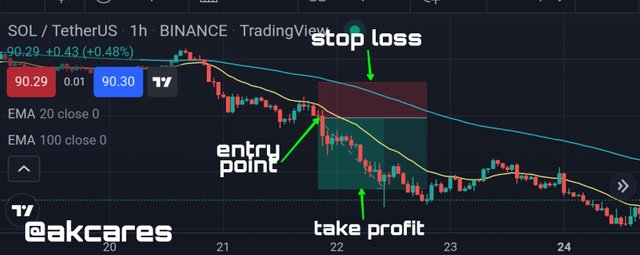
The trade is placed at the start of the second bearish candlestick after the bounce. The risk to reward ratio of the trade is set at 1:2 with the stop loss placed just above the SMA 100 line.
This is so because if the price should cross the SMA 100 line, it means that the initial down trend has been invalidated and a trader should leave the market. Crossing over and going above the 100 moving average line is the exit signal.
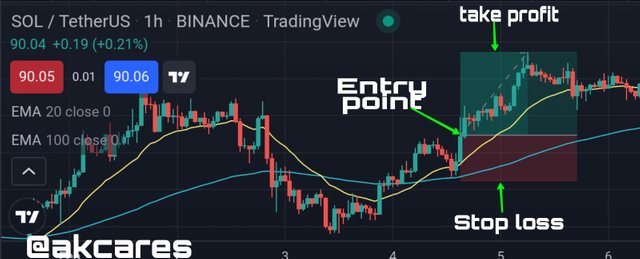
- Bullish Trade
The same market price chart of Sol/Tether USDT is used for this demonstration.
To take a buy trade, the trend must be moving upward as seen here. This is supported by the fact that the moving average is under the price bars. This shows that the price is on an increase and that buyers are in control of the market.
During this period, price is also unable to break below the moving average line which makes it a support level.
The trade entry is signaled by the fast moving average. This happens when the price retraces downward briefly. It gets to the EMA 20 line and bounces back up in the direction of the original trend.
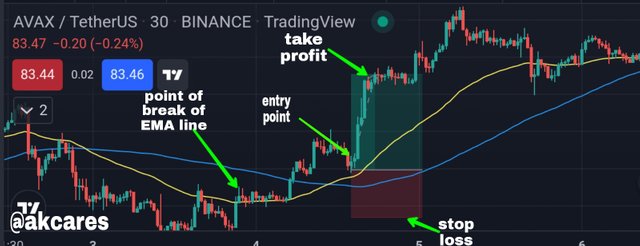
The trade is placed on top of the second bullish candlestick after the bounce. The risk to reward ratio of the trade is set at 1:2 with the stop loss placed just below the SMA 100 line.
This is so because if the price should cross the SMA 100 line, it means that the initial uptrend has been invalidated and a trader should leave the market. Crossing over and going below the 100 moving average line is the exit signal.
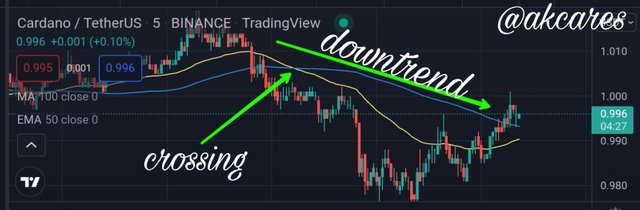
What do you understand by Crossover? Explain in Your Own Words.
A popular concept associated with moving average indicators is the cross. Mostimes, to get the best results from using a moving average, a combination of two or more moving averages are usually applied though it is mostly two that are used by the majority of traders.
The two mostly used are one that has a longer period length and one that has a shorter period length. The longer period moving average which is slow moving, is to indicate the overall trend since it requires more data points to produce its signal, while the shorter period moving average which is fast moving, is to show sharp price fluctuations because it uses less data and information to produce its signal.
The cross usually occurs when the shorter period moving average goes over above or below the longer period moving average.
The occurrence is usually a signal of an impending reversal in the current market trend and shows opportunities for traders to take action in the market either by closing open positions or preparing to take new trades once the cross is confirmed.
This cross, depending on the direction can signal with a sell or a buy opportunity.
If the fast moving, short period moving average is coming from under to cross and and go above the slow moving average, then it signals a reversal from a downtrend to an uptrend and thus, a buying opportunity.
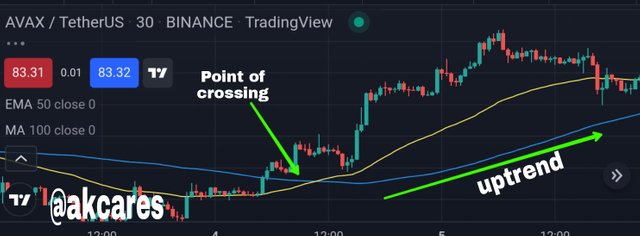
If the fast moving average is crossing from up to down below the slow moving average, then it signals a trend reversal from a bullish trend to a bearish trend and thus suggests a selling opportunity.
Conditions that Confirm and Support the Cross
There are some conditions that validate the authenticity of the moving average crossover. Some of these are:
The market must have a clear direction and must be trending. Ranging markets and sideways markets are bad conditions for using the cross.
There should be some form of price rejection noticed in the terminating trend.
The chosen moving averages must be in line with the trading regime. Long term traders would benefit more from using longer period moving averages while short term traders would be more profitable using short length moving averages.
Other technical indicators should be able to produce more confluence in line with the cross.
Explain The Limitations of Moving Average
Moving average is on the list of technical indicators we have in cryptocurrency trading and a common knowledge about technical indicators is that they can sometimes give misleading signals either because of purposeful manipulation by market players or due to other factors.
Moving average has a lot of use cases and is greatly used by most traders. Even with this, it still has its own weaknesses and low points.
Moving average is a lagging indicator. It is computed using historical price data. It Does not include the immediate price action.
Traders can be made to follow signals that have already played out because of the trend-following nature of the indicator.
Traders can not make use of the moving average indicator if the market does not fit some of the requisite conditions like having a defined trend and showing price rejections.
Failure to apply the right period length in setting up the moving average can lead to bad trades for a trader and the indicator works with a period function.
The signal from the moving average is not holistic enough as other factors such as fundamental triggers like news can influence the asset's value.
As these limitations have been clearly stated thus, it behoves a wise trader to seek ways of increasing the probability of his analysis and adding more confirmations to his trade to avoid falling victim to the weaknesses of the moving average indicator.
This he can do by employing other technical analysis tools and techniques.
- All images this assignment were gotten from Trading View
In the current time, there are lots of enterprises that people embark on that are solely dependent on chance occurrences. Everything is put on baseless predictions and speculations.
In a way, even trading the cryptocurrency market is a prediction game, but the good thing about this is that there are some tools, strategies and skills a trader can apply to make his moves in the market more assured and of higher probabilities. Trading the cryptocurrency market can be a real scare.
However, making use of technical analysis tools gives a high level of confidence to a trader. Moving average indicator is one tool that can be used to smoothen things for the trader.
They have been applied to trade the cryptocurrency market for a long time. There are however some variations about them. But generally, they are very useful in guiding trading decisions.
A trader's task is now understanding what these indicators represent and how it works. With this information, a trader can conveniently apply it to his trading regime and be sure to have more wins than losses. Great lesson here by Prof. @shemul21
