"Reading Special Bar Combinations - Crypto Academy / S5W8 - Homework Post for @sachin08

I am aware that there are different kinds of charts used to represent cryptocurrency assets and their performance in the market.
However, I have rarely made use of any of them as the Japanese candlestick chart has gained more prominence and popularity.
Thankfully, Prof. @sachin08 has explained this aspect of bar chart so well. I now have a better understanding of how this chart can be utilized. My assignment answers are given below.
Explain Price Bars in your own words. How to add these price bars on Chart with proper screenshots?
Price bars are bars used to represent the price action of a crytopcurrency asset in the market. It is contained in the price bar chart which is one of the different types of charts used to depict the crytopcurrency market just like the Japanese candlestick , line, heikin aishi, renko, kagi charts among others.
In price bar chart, bars are used to show how buyers and sellers in the market operate and transact with a particular asset.

The activities of buyers and sellers determine the type and anatomy of the price bar formed.
The price bar like the Japanese candlestick has different part.
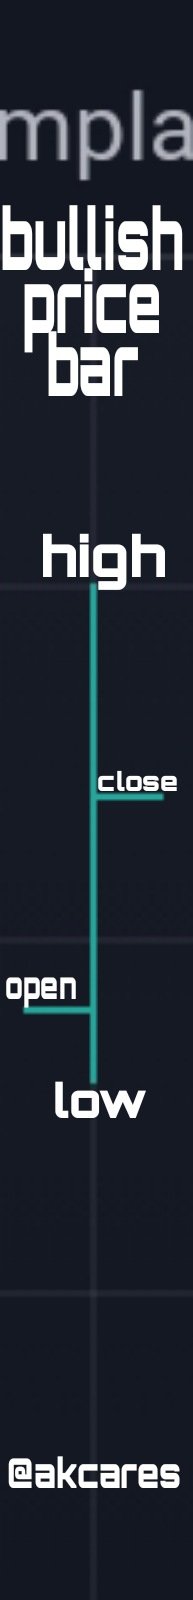
A typical price bar comprise four different parts which are: the open, close, high and low.
Open
This is the point from where the bar begins to form. This is represented by a horizontal line on the bar extending towards the left
Close
This is where the bar terminates after a certain interval. This is represented by a horizontal line on the bar extending towards the right.
High
This is the highest price that the asset has climbed to during the interval. It is shown by the uppermost tip of the vertical bar.
Low
This is the lowest price that the asset has dropped to over the interval. This is shown by the lowest tip on the vertical bar.
Bar formation is usually, subject to the time frame used. In a 30mins time frame, a new bar will begin to form and will continue to form for the next 30 minutes then terminates and a new one is begins.
Adding Price Bar to Chart
To add price bar on a chart, I will first launch my trading view app.
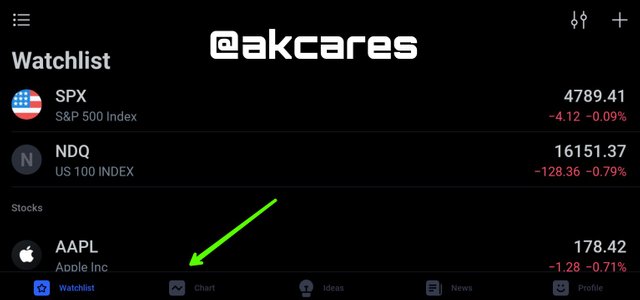
From the interface, I click on charts.
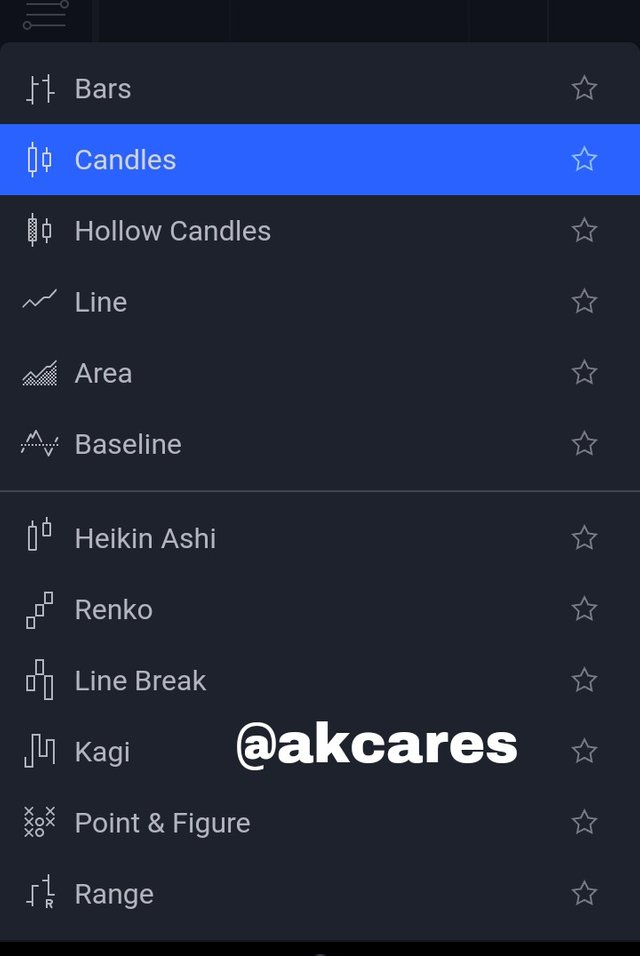
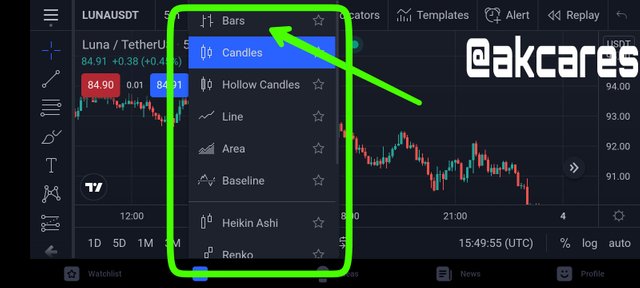
Normally, this will open with the Japanese candlestick chart. I then locate the chart buttons in the top menu bar and then click it.
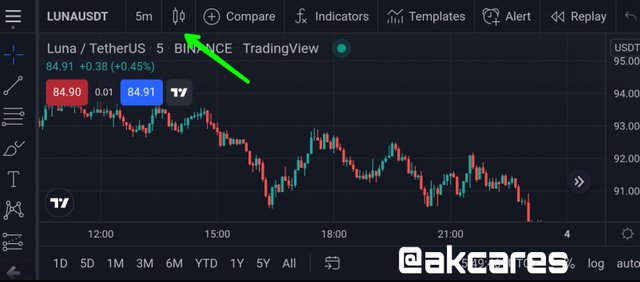
A list of different types is chart is shown. From here I select the BARS option and the Price Bar chart is displayed.
How to identify trends using Price Bars. Explain for both trend. (Screenshots required)
Just like other charts, price bars can be used to effectively identify and pick out market trends. The structures formed by the bars are the primary tool for picking out trends.
Bullish Trend
In a bullish trend, there would be dominant formation of bullish bars with price printing a series of highs higher than the previous highs and lows, higher than the preceding low.
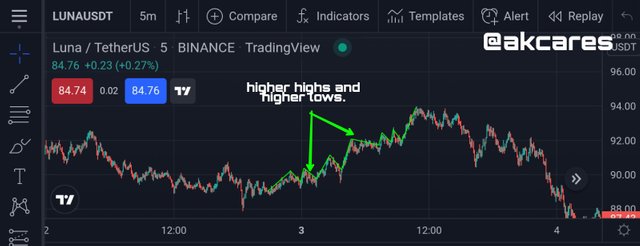
This means that, price will keep closing higher than previous close and opening at points higher than the previous open.
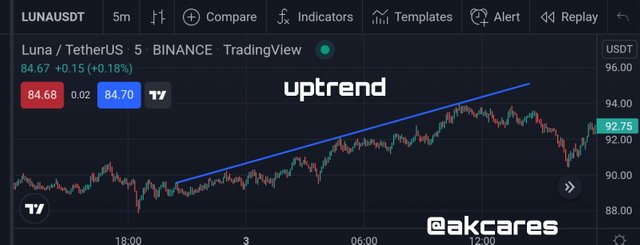
This gives a chain where there are numerous higher highs and higher lows with price climbing higher and higher after intermitent minor retracement.
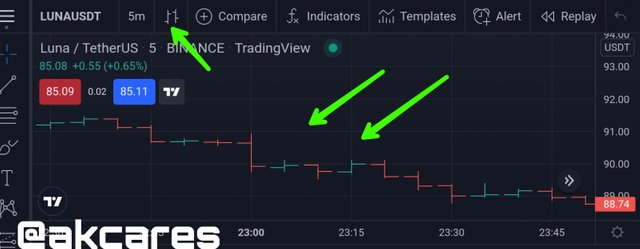
Bearish Trend
In a bearish trend, there would be more formation of bearish bars with price printing a series of highs lower than the previous highs and lows, lower than the preceding low.
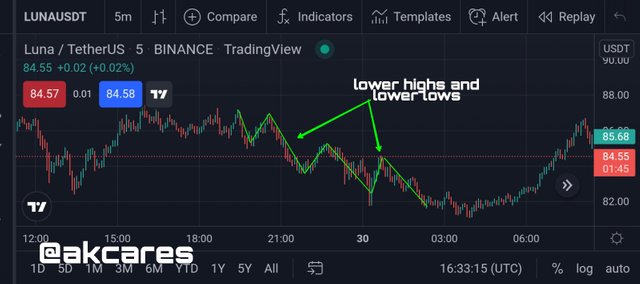
This means that, price will keep closing lower than previous close and opening at points lower than the previous open.
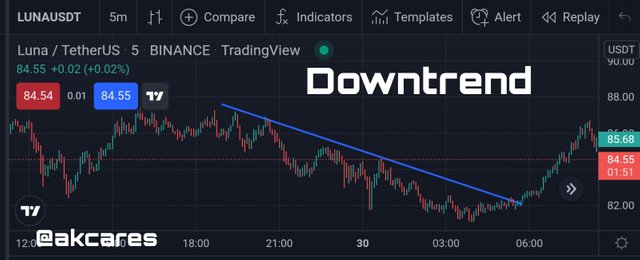
This gives a chain where there are numerous lower highs and lower lows with price continously dropping lower and lower in a diagonally descending pattern after intermitent minor retracement.
Explain the Bar Combinations for Spending the Day inside for both conditions. (Screenshots required)
There is a certain sense of humor I get from the names of these bar combinations because they names just seem to show exactly what the situation is in a very simple way.
Spending the day inside is just when an individual refuses to step out of the house but just chooses to lock himself inside his room.
This price bar combination shows that price has not made any major significant move in either the upward or downward direction.
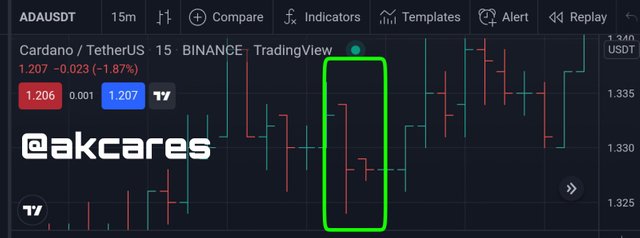
This combination consist of two bars. One is a large bar and the other is a small bar. Here, the preceding bar which is much larger completely engulfs the succeeding bar. The succeeding bar is staying inside the preceding bar with the low higher than the last low and the high being lower than the last high.
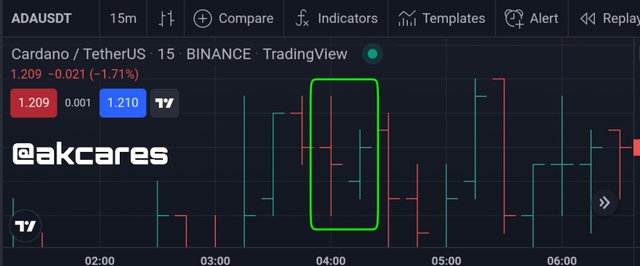
This combination does not give any signal of impending reversal or continuation rather it indicates that no set of market players are in control at the time but they are indecisive about whether to transact with the asset or not.
Explain the Bar Combinations for Getting outside for the Day for both conditions. (Screenshots required)
From this simplified name given to this bar combination, it is very easy to get an idea of what it means. When someone wants to get outside, you will mostly see the person standing at or close to the door. This person will ensure that he has free movement and no body or anything is going to hold him back.
The bar combination for getting outside for the day is just like this. Here, we find that the points of open an close of the next bar are outside and beyond the previous bar.
In an outside bar, the two points of open and close are always positioned very close to or at the extremes of the vertical bar up and below. You will find the short horizontal lines of open and close at the ends of the bar suggesting a kind of tendency to move outside from the bar.
There are some major features of the outside bar to look out for in order to determine if the bar is indicating a potential trend or a reversal. Depending on which of horizontal lines is placed higher or lower than the other, a trader can tell if buyers or sellers are in control or are trying to control the market.
Bearish Outside Day
When the open is at the top end of the vertical bar and the close is at the bottom end, this is a bearish signal.
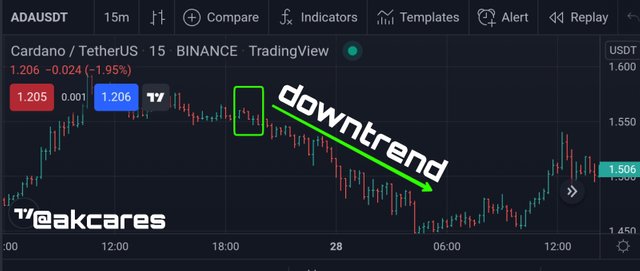
If these points of open and close are lower than the previous bar's open and close, that is formation of a lower high and lower low, it means that the price is moving downward.
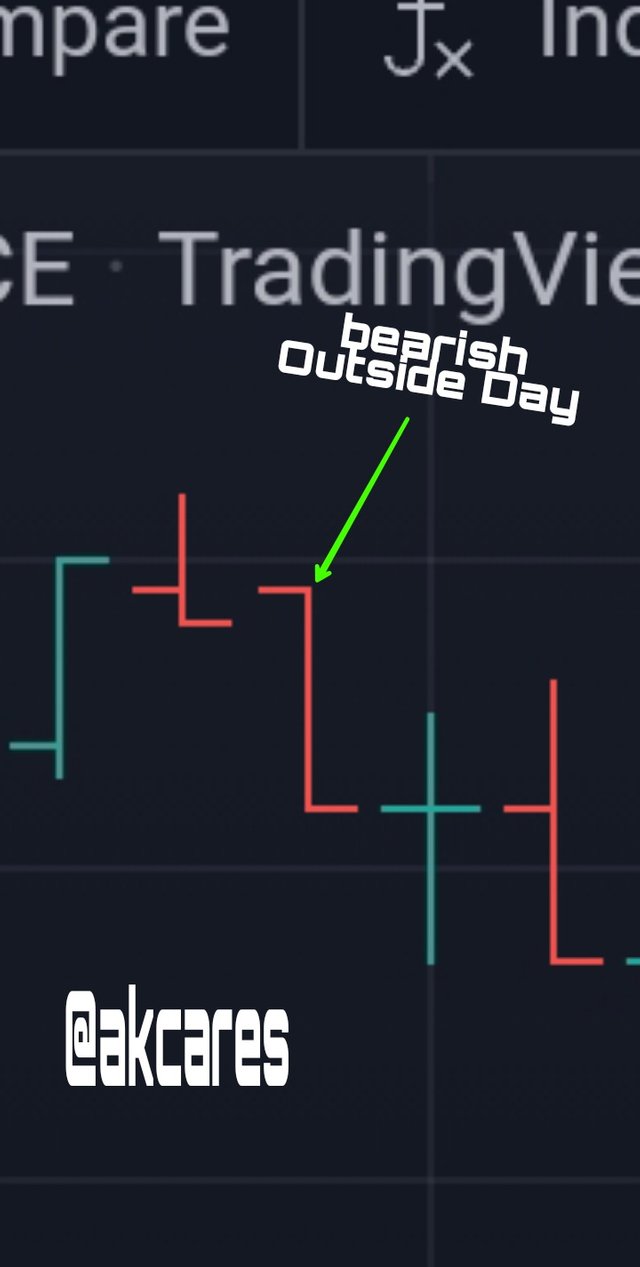
If this occurs in a downtrend, it is a continuation signal showing that the current downtrend will still be on. If it occurs in an uptrend is signifies a reversal that the current uptrend will soon be reversing to a downtrend.
Bullish Outside Day
This is shown by open being placed at the bottom end and the close at the top end of the bar.
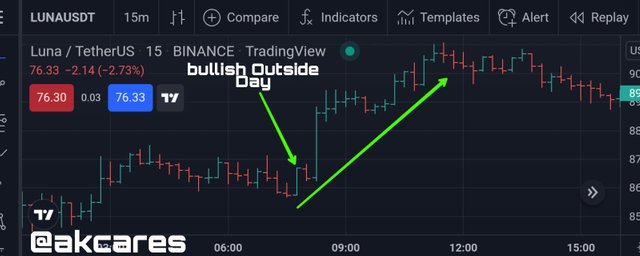
When this forms a higher high and higher low that is the open and close are at higher points when compared with the previous bar, it shows that price of the asset is gaining and moving up.
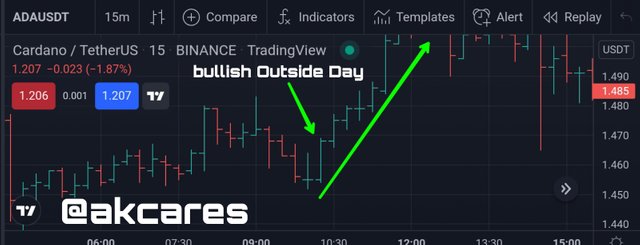
When this happens in an uptrend, it shows that they trend will continue. If it happens in a downtrend, it shows that the downtrend will soon be reversing.
Explain the Bar Combinations for Finding the close at the open for both conditions in each trend. (Screenshots required)
In finding the close at the open bar combination, the major feature to look out for is the bar having open and close at or almost the same point on the bar. Depending on whether this is at the top, middle or bottom of the bar, a trader can draw very useful information from this.
When this bar combination occurs at either ends of a bar, it is easy to tell the situation of the market, that is, if a continuation or reversal is about to happen with respect to the current direction that the price is moving at. This has special significance especially when it occurs in a consecutive series of bars.
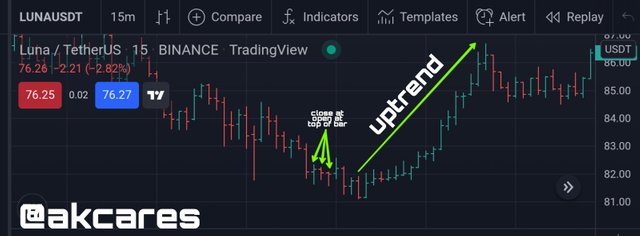
Finding the Close at the Open in an Uptrend
When the combination is at the top of the bar in a downtrend, then there are higher chances of the current trend being reversed. If it occurs at the bottom of the bar, then it signals reversal.
Finding the Close at the Open in a Downtrend
When the combination is at the top of the bar in an uptrend, then there are higher chances of the current trend continuing. If it occurs at the bottom of the bar, then it signals that the downtrend will most likely continue.
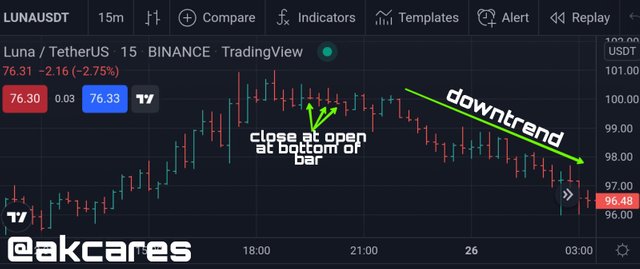
Finding the close at the open generally shows a situation of indecision in the market but where this occurs goes ahead to tell what is happening.
All screenshots were taken from Trading View
I have been well accustomed to chart patterns and shapes with the Japanese candlestick chart. This lesson about bar chart combinations and patterns has made me realize that, not only are there several other cryptocurrency charts, but that each chart has its own uniqueness, application and interpretation.
The price bars have very interesting anatomy whether bullish or bearish. The bars comprise different parts. From this anatomy and the placement of the parts, it is possible for a trader to gather very useful information with which to undertake trading activities. A trader can deduce what the market situation is, the prevailing trend and most importantly, the potential of a trend to continue or reverse.
Armed with these details, the bar chart can be very useful in technical analysis. A trader intending to make use of this has to properly study it, know they various combinations patterns available, be able to correctly identify them and lastly carry out proper interpretation. Great lesson by Prof. @sachin08
