[Terra Luna]- - | Steemit Crypto Academy | S6t3 - Team Trading Contest Post for team-frontline
.png)

THE PROJECT
TERRA LUNA
Terra is a decentralized blockchain network that was founded by Daniel Shin and Do Kwon. It makes use of stable coins pegged to fiat currencies in powering static price global payments.
The development of the Terra network started in 2018 with them launching its main net in mid-2019.
Currently, the Terra network has stable coins pegged to various fiat currencies which include; the US dollar, Mongolian tugrik, South Korean won, Chinese yen, etc with more options in line to be added soon.
It has a native token popularly known as Luna which is used in stabilizing the various stable coins of the Terra network.
The Luna token also serves to promote the decentralization and security of the Terra network by giving holders the right to decision-making on the platform thereby serving as a governance token.
TOKENOMICS
The current pride of Luna at the time of writing is $95.23. It has a current market cap of $34,457,842,578 with a rank of #8.
Its current circulating supply is 361,832,564.95 LUNA, with a max supply of 759,166,905.
ANALYSIS
In this section, I will be performing some technical analysis on the Luna token in other to spot either a buy or sell signal.
I started by opening a LUNA|USD pair on my real MT5 account after which I added some indicators in other to properly interpret the price behavior and patterns.
The indicators added were a 50-period EMA and an RSI Indicator. The EMA serves to identify the price direction by filtering out minor price fluctuations thereby making apparent the actual price direction.
The RSI on the other hand is a volatility-based indicator that gives out a signal by identifying when the price is either overbought or oversold.
When an asset is overbought the RSI indicator signals a bullish-to-bearish price reversal by being at or above the 70 mark.
When an asset is oversold, the RSI indicator signals a bearish-to-bullish price reversal by being at or below the 30 mark.
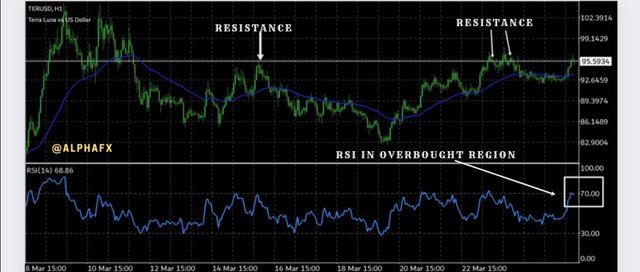
After the addition of the above indicators, I switch to a 1 hr timeframe in other to properly observe the price position and spot out more reliable support and resistance areas.
On switching to the 1 hr timeframe, I observed that the price is currently at a strong horizontal resistance zone which indicates a possible pullback or price reversal.
Also, the RSI indicator was found to be at the 70-mark which represents asset overbought thereby signaling a price pullback or bullish-to-bearish price reversal.
- Screenshot
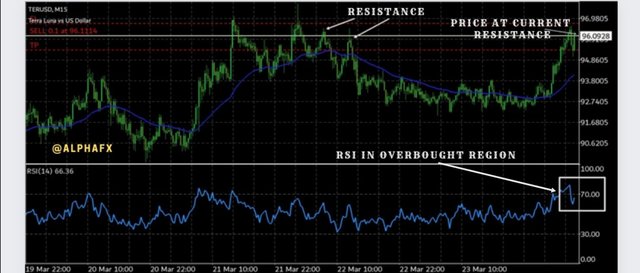
After my analysis on the 1 hr timeframe, I switched to a 15mins time frame in other to confirm what I observed on the 1 hr time frame.
- Screenshot
The Trade
Switching to the 15mins timeframe was also to allow me to find a proper entry for my trade and also reduce the size of my stop-loss as I am a small capital trader.
On switching to the 15mins timeframe, I observed that the price is also at a resistance area with the RSI also being at the overbought region which signals a bearish price movement.
Seeing the above confluence, I decided to take a sell position.
After making my entry using the 15 mins timeframe, I kept observing the trade in other to be certain it is going as predicted.
- Screenshot
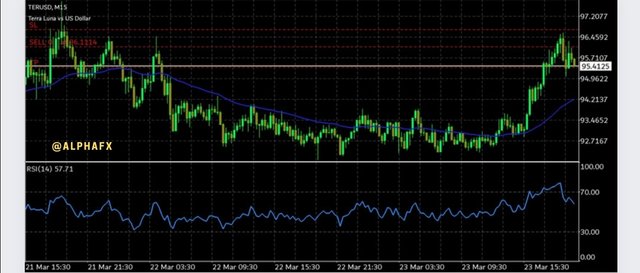
From the above screenshot, we will see that the trade is going exactly as predicted.
Exit
I applied an exit strategy based on the market structure by setting my stop-loss just above the resistance area and my take profit just at the closest support which is also in consideration of my stop-loss in a ratio of 1:1.
Trade Details
| PARAMETER | VALUES |
|---|---|
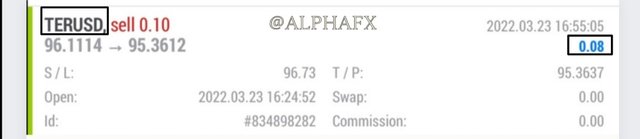
| Entry | 96.1114 |
| Take profit | 95.3637 |
| Stoploss | 96.37 |
| risk to reward | 1:1 |
| Closing price | 95.3612 |
| profit/loss | $0.08 |
CONCLUSION
On today's trade, I was cautious enough not to be greedy which made me use a very small lot size thereby risking only 1 percent of my small capital.
At the end of the trade, I was able to secure a profit of 1.6% on my small capital of $5.
Please check your heading
Thank you