[Trix Indicator]- Crypto Academy /S6W3-Homework Post for kouba01
.png)

1. Discuss in your own words Trix as a trading indicator and how it works
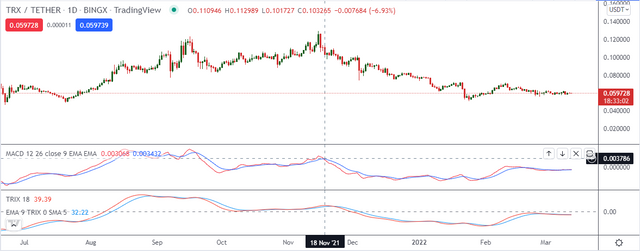
Trix Indicator
Source
The Trix indicator is a technical indicator created by Jack Hutson in the early 1980s. A moving average based indicator, it employs the mechanism of a triple exponential average. This system of averaging enables Trix to filter the noise on the chart.
Just like any other indicator, Trix does not give all, but a part of the analytical information required to enter a trade, but is used to confirm trend direction, thereby filtering false signals frommthe other indicators or trading tools/systems, combined with it.
Mode of Operation
The Trix indicator derives its mode of operation from its root factors; exponential moving averages. An MA in its basic form calculates the average price per unit time, the EMA makes it an exponential average, thereby reducing the lagging nature of moving averages, as it responds to price quickly, while still being able to avoid the noise from the chart produced by reactonary trading.
The lag-solving nature of the EMA turned to be a disadvantage to it too. Why? Well unlike moving averages that calculate the average across the chart, the EMA gives more relevance to the recent prices, meaning a strong reactionary response by traders on the chart will have a dent on the credibility of the EMA.
Jack Hutson came up with the idea to solve this problem. The idea was simple; if the EMA was working, then compounding the formula thrice should be 3x more effective. This gave us the TRIX, an indicator that avoids the lags from simple moving averages, while eliminating the relevance of reactionary traded recent prices.
2. Show how one can calculate the value of this indicator by giving a graphically justified example? how to configure it and is it advisable to change its default setting? (Screenshot required)
Trix is calculated through EMA of closing price, then generating an EMA from this EMA. The second EMA is finally used to generate a third EMA. This simplified explanation should throw light on why its a triple exponential moving average.
TRIX = (EMA3(t) - EMA3(t-1)) ÷ (EMA3(t-1))
Where:
EMA1 = EMA{previous close}
EMA2 = EMA{EMA1}
EMA3 = EMA{EMA2}
t = time/period
This calculation is just portraying a simple concept. An EMA smoothens price but might be susceptible to noise. So why not get an EMA of the EMA? This thought must have occurred to Jack Huston as he pondered on the EMA, and at the end, he opte to get an EMA of the EMA of the EMA, the ultra smoothening of price, as seen in the image below.
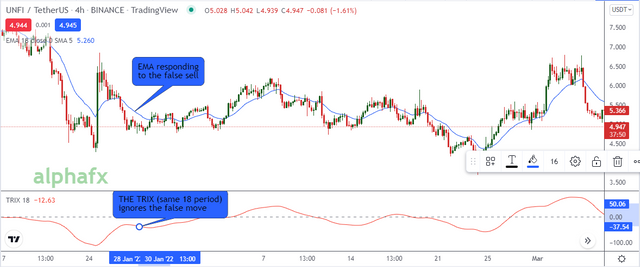
Source
In the image above we can see a classic case of the Trix smoothening and ignoring the noise from the EMA, as a result of reactionary correction of that MARUBOZU candle.
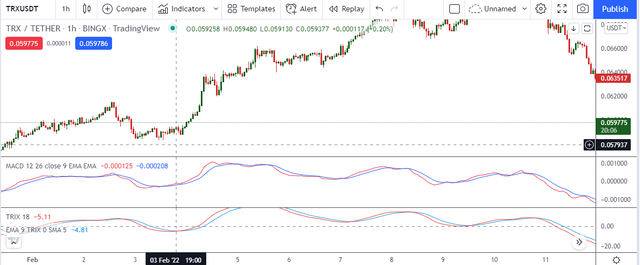
Using Trix on tradingview
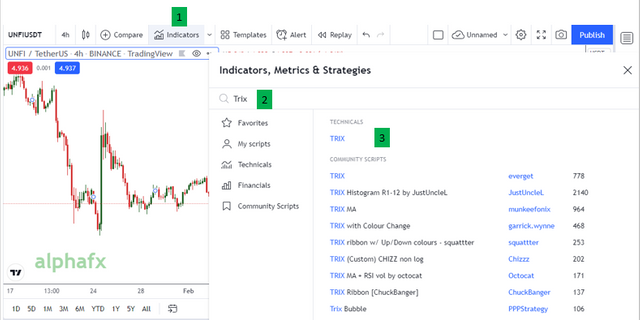
Setting up the Trix indicator:
- Click on the "indicators" option on the chart
- Type in "Trix" in the search bar.
- Select the option indicated above, as that is the standard indicator as propounded by Jack Huston.
- Result
Source
The indicator with its default setting is applied on the chart.
Configuring The Indicator
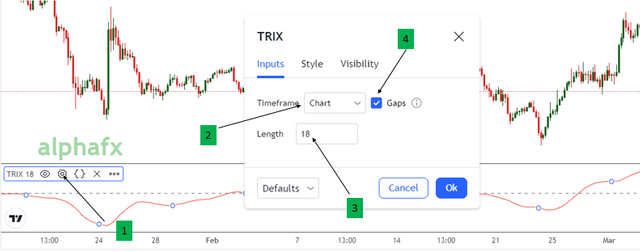
Step 1:
Click on the settings icon beside the name of the indicatorStep 2:
Select the timeframe you want the length to be calculated from, I recommend leaving it at "timeframe". This setting adjusts the indicator as you change the timeframe, unless you want to trade on one timeframe but search for entries on lower timeframes, then setting it to your desired timeframe eg. 4-hour, would be recommendedStep 3:
Set your length/period. I usually advocate high periods to filter the noise from MAs, but the TRIX is an extremely filtered MA and can give late signals. I recommend a very low period, eg: 3Step 4:
I recommend you leave the gaps on as the default settings do.
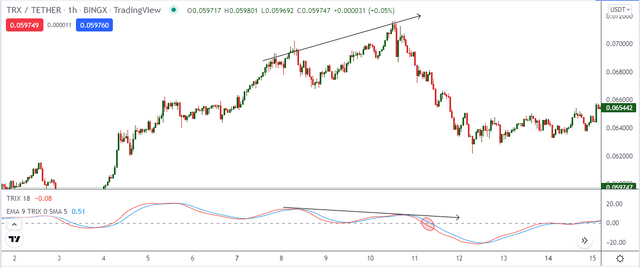
Is it advisable to change its default setting?
The most significant setting here is the length/period, and yes, I advise you to change it, because it is an over filtered signal. This results to the signals arriving too late at times.
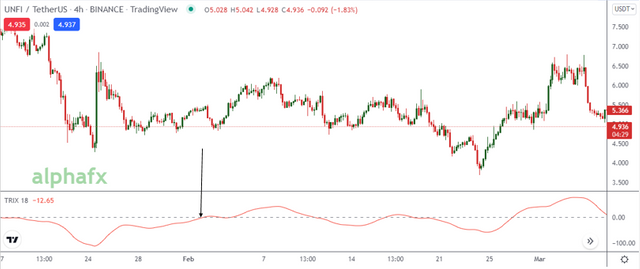
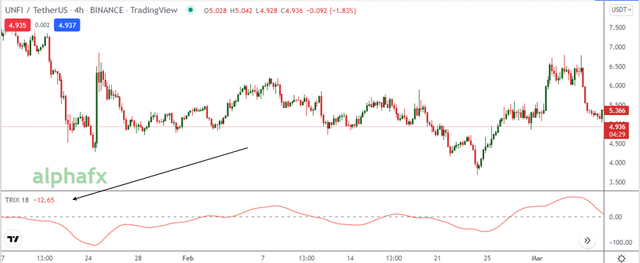
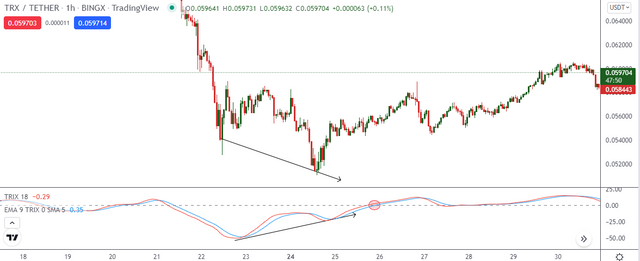
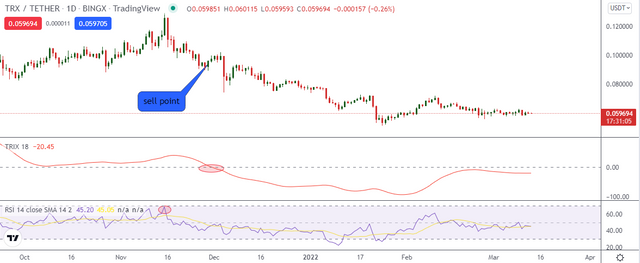
Source
This is an example of the default setting signalling a buy, then price pulls back. This late signal identified the entry toolate, a trader's position can be taken out if he enters based off this signal.
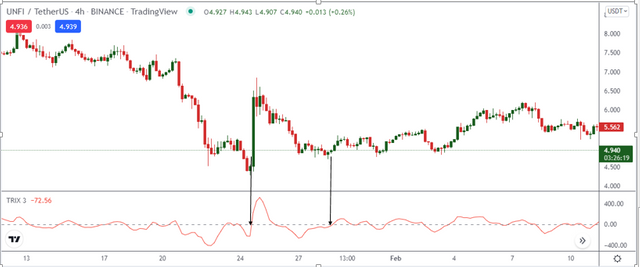
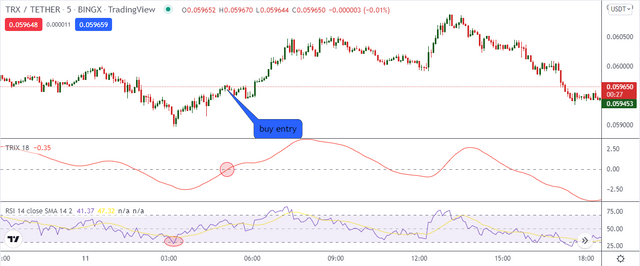
Source
Fine tuning the settings to a period of 3 made the signals more accurate. This i the exact same chart and we can see the Trix indicating a buy at the level the trader using the default settings would have been taking out (your stoploss is my entry). The trader from this scenario either stays patient for the profits or breaks even at the least.
3. Based on the use of the Trix indicator, how can one predict whether the trend will be bullish or bearish and determine the buy/sell points in the short term and show its limits in the medium and long term. (screenshot required)
The Trix indicator uses the 0-line to indicate trend direction. Price above the 0 line signals an uptrend and below it signals a downtrend.
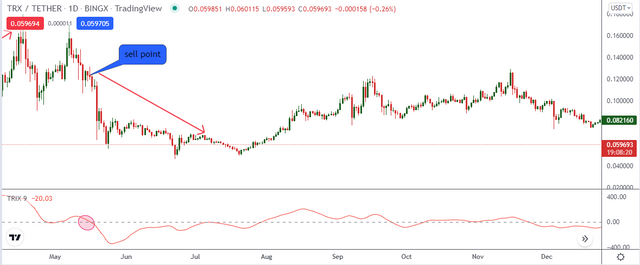
Bullish Trend and Entry
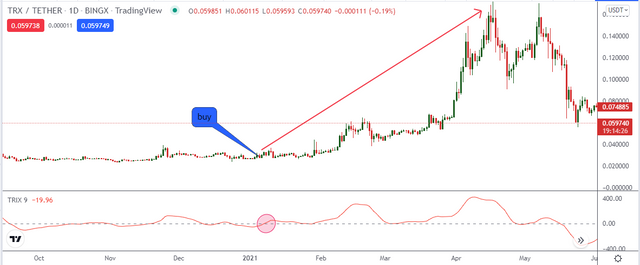
Source
From the above image, we can see the Trix cut across the 0-line and signal an uprend, and we can see the price starts buying soon after and a very solid buy it was. The other signals before this however showsnwhy you should combine other indicators to avoid the inefficiency of Trix in a sideways trend.
Bearish trend and Entry
Source
The trix indicates a sell by crossing the 0-line to trade below. This is a sell signal and traders should enter at this point. The market sells considerably before the Trix nears the 0-line again.
While all these are applicable, its not advisable to use the Trix for market entry, rather it is a pretty useful tool for trend confirmation.
Limitations in the Medium and Long Term.
Source
As much as I've fine-tuned my Trix indicator to be as accurate as possible it still has a very glaring limitation in the medium and long-term trading scene.
I really cannot claim to have much on this subject matter, but in the medium and long term trading, the Trix indicator is very limited when the market is in a sideways trend. Market becomes choppy and it gives out false signals like the two we can see above. The problem is, being a trend-based indicator, there is no way for the Trix to escape this li citation, however we can easily solve this problem by combining it with an indicator like the RSI, as we can see below.
Source
On the RSI now, those two signals have no backing, and we can easily avoid them, and right before the next sell signal (highlighted in green), we can see the RSI indicating an over-buy (also in green). This is confirmation from the RSI that a sell is in order.
4. Comparing the Trix indicator with the MACD indicator, show the usefulness of pairing it with the EMA indicator by highlighting the different signals of this combination. (screenshot required)
Trix and EMA
The Trix and the EMA are used like normal moving averages. A cross signals a change in trend direction, and the Trix (slower MA) is crossed by the EMA to signal this.
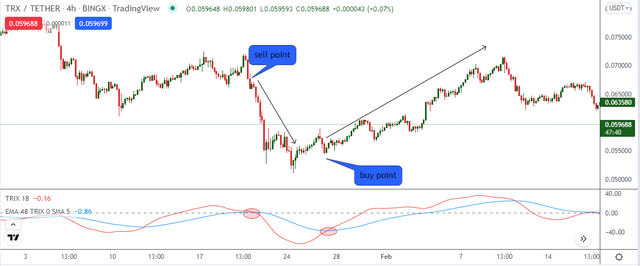
FOR THE SELL
We saw the Trix(blue) is crossed by the EMA to signal a sell and trades below
Next the Trix and EMA began trading below 0-line (not necessary for this analysis but an extra confirmation)
Market obeyed analysis and sold.FOR THE BUY
The EMA crosses the Trix and trades above it
MArket began a buy
MACD, EMA and Trix
Combining these three indicators, what we look out for is crosses between the MACD and EMA, then the Trix and EMA. When these two conditions are met, the 0-line is crossed by the Trix and EMA to confirm the trend.
Selling
Source
The MACD when combined with the Trix produces clear signals. We can see an example here on the chart, from the level of the cross. The MACD and Trix were both combined with EMA9, and here was the resulting signal
MACD first begins trading below the EMA line - SELL SIGNAL1
Trix next begins to trade below the EMA line - SELL SIGNAL 2
Trix and EMA crosses and trades below 0-line - SELL CONFIRMATION
Buying
Source
The MACD as usual is the first to cross the EMA and trade above it - BUY SIGNAL 1
The Trix also crosses the EMA and we have - BUY SIGNAL 2
Both Trix and EMA crosses the 0-line and begin to trade above it - BUY CONFIRMATION
5. Interpret how the combination of zero line cutoff and divergences makes Trix operationally very strong.(screenshot required)
Ok this one is a feature I really like. Trading divergences is one of my all time favourites and seeing it on the Trix is just beautiful. The concept behind this is spotting a divergence before the Trix breaks the zero line as a double confirmation for a trend.
Buy Signal
Source
The chart indicates a lower high and a higher high next. On the Trix however, we can see a higher high before a lower high, this is the first sell signal.
Next we can spot the TRIX and EMA twist, then break the 0-line, this is what we are waiting for and our entry is taken at this point.
Sell Signal
Source
The chart shows us a lower low then a high low, however the reverse is the case on the Trix indicator - Divergence spotted
Next the Trix and EMA twist to signal a buy
Finally, the TRix and EMA break the 0-line and trade above it - ALL CONDITIONS FOR BUY MET
6. Is it necessary to pair another indicator for this indicator to work better as a filter and help eliminate false signals? Give an example (indicator) to support your answer. (screenshot required)
IS IT NECESSARY? YES!
Like I said before, the Trix indicator only indicates market direction, this is not enough to analyze the market. Using the RSI which indicates momentum, we can view two aspects of the market that can provide trend direction and a good entry point. See the following examples;
- I first spotted an overbuy in the RSI, this meant the buyers were soon to lose momentum.
- Next the broke the 0-line downwards, confirming the sell.
- There was a 50% drop in price.
Source
This is an example of the combination working for a buy.
- RSI at 30 level, signalling an oversell and an impending buy
- The Trix crosses the 0-level to signal and confirm the buy
- market begin to buy, peaking at 10% profit.
7. List the pros and cons of the Trix indicator
| ADVANTAGES | DISADVANTAGES |
|---|---|
| Trix filters market noise | Does not give good entry points |
| Does not lag | is not ideal in a sideways market |
| it indicates market direction | signals can come late |
| can be used across multiple timeframes | Not advisable to be used alone |
| Shows divergences for reversals | not advisable for scalpers. |
Conclusion
Trix is not on my list of favourite indicators, but I can say it serves as a good trend indicator, and an impressive tool for technical analysis. Using it alone is not recommended.
However, combining it with the EMA, RSI or MACD highly increases your chances of successful trading. Trend indication with an incorporation of measurement of sentiment or momentum are comprehensive set of technical tools for analysis.
Thanks for reading.