Price Action + Break-Even Technique - Crypto Academy / S4W4 - Homework post for @ lenonmc21
Am gladdened once again for yet another opportunity of this wonderful edition by the cryptoacademy. From the lecture offered by Professor @lenonmc21, reading through this lecture series have given me a better insight on Price Action + Break-Even Technique. To this, I will be writing based on the task given by the Professor.
Theory
1. Define in your own words what Price Action is?
Price Action as the name implies is simply being able to understand the influence of price on an asset. It talks about the changes in price (be it high or low) and how it affects the movement of asset without using other added tools for analyses.
2. Define and explain in detail what the "Balance Point" is with at least one example of it (Use only your own graphics?
Balance point is the point at which a trend retraces or stops its continuity. Take for instance, in an asset chart where the asset is moving in an uptrend direction or bullish, the candle stick at which it retrogrades back in a downtrend direction or bearish direction is what is known as balance point.
3. Clearly describe the step by step to run a Price Action analysis with "Break-even"?
To run a price action analysis with “break-even”, we first select one time frame that we are to work with (depending on what the investor or trader wants). The time frame might be 1 minute, 30 minutes, 1 hour, etc.
After selecting the time frame, you than spot the important points where there is an impulse or retracement in the trend of the asset you are working with (these retracement points are points where you can take profit if you make an entry).
After identifying these high points of retracement on the market (price) chart of the asset, you then determine the equilibrium (balance point) based on the present trading direction of the asset and spot your possible points of entries or points to take your trade.
4. What are the entry and exit criteria using the breakeven price action technique?
First, the balance point must be obtained where the break-even or the change or retracement of price of asset will take place. After there is a break-even with a candle stick showing, this is when we can make an entry of trade.
After making an entry, we then set our stop loss below if it is a buy entry and if it is a sell entry, we set our stop loss above depending on the trend direction of the asset
5. What type of analysis is more effective price action or the use of technical indicators?
In my opinion, price action is easy although its effectiveness I will say is not 100% likewise the technical indicators because at times the influence of whales might cause a great volatility of the assets.
We all know that the influx of buyers and sellers plays a great role as to the control of price trends of an asset. But I will prefer going for the price action analysis since it deals with current price state of an asset.
Practice (Only Use your own images)
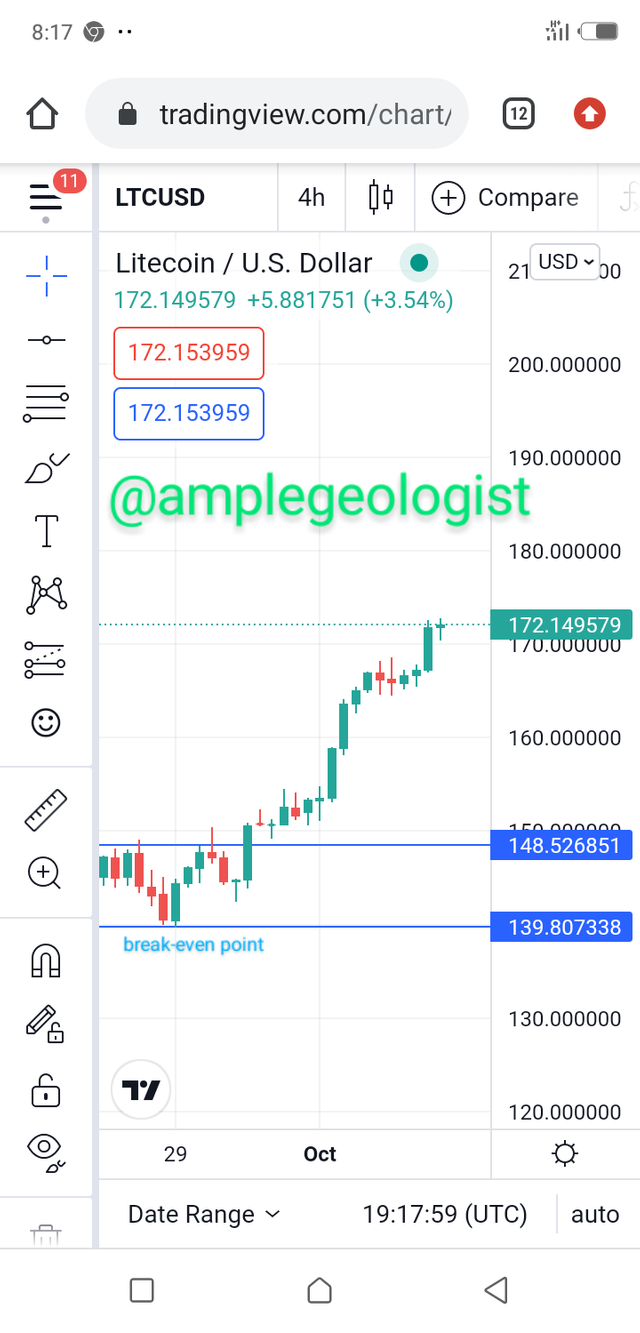
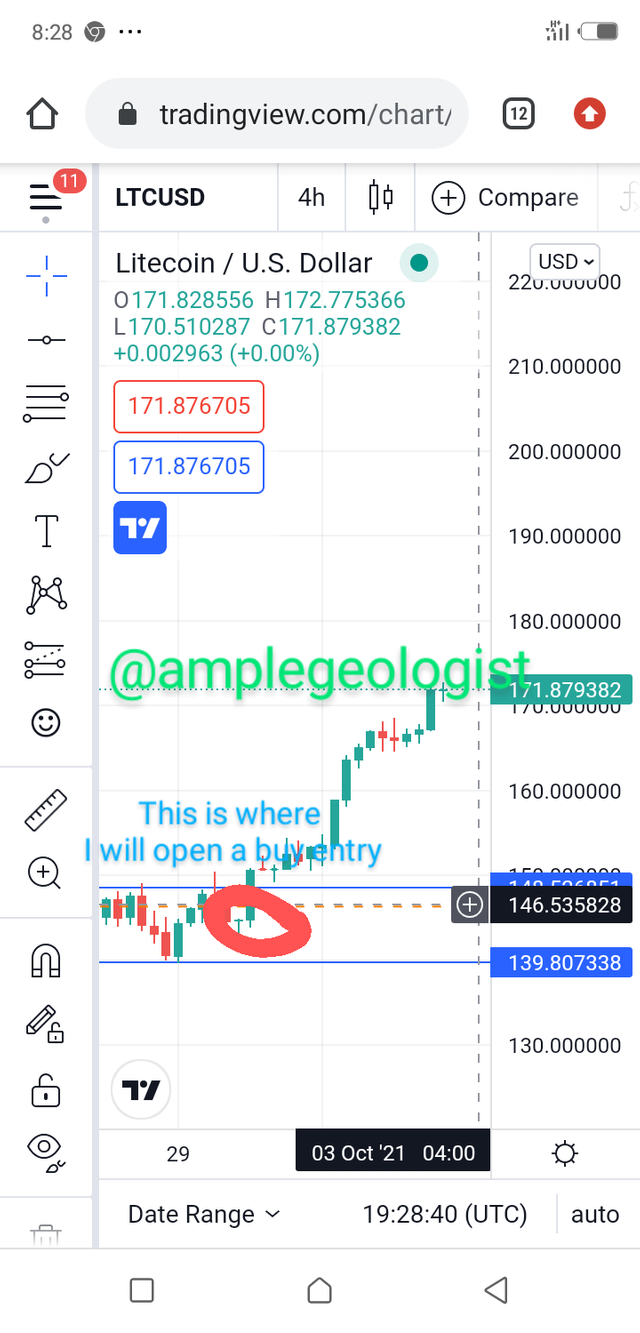
1. Make 1 entry in any pair of cryptocurrencies using the Price Action Technique with the "Break-even Point" (Use a Demo account, to be able to make your entry in real time at any timeframe of your choice)


