CRYPTO ACADEMY | SEASON 4 | WEEK 2 | HOMEWORK POST FOR PROFESSOR @reminiscence01.
TECHNICAL INDICATORS.
Technical indicators are frequently used by people who trade actively because it is designed to help in the analysis of short-term movements of the price of an asset, but people with long-term investments can also use it to determine a good entry point and a good exit point.
Technical indicators are good technical analysis too because they provide clues for the
investors, thus helping them to interpret the patterns of the market and the possible behavior of the price of an asset in future. This clues will now help the investor to maximize his/her profits.
They are also good technical analysis tool because of their ability to provide a viewpoint on the strength and direction of the price action of an asset. It is to alert, predict, and even confirm stock prices. Because these prices fluctuate continuously, it is readily cumbersome to accurately track it. But here the Technical indicator comes handy in this aspect. The Technical indicators presents the data accurately and make it very easy to understand.
ARE TECHNICAL INDICATORS GOOD FOR CRYPTOCURRENCY ANALYSIS.
In as much as cryptocurrency is an investment vehicle, then technical indicators are very important for its analysis. This is because it helps the cryptocurrency investors to determine a good entry point and exit point for his/her cryptocurrency investment.
Technical indicator determines the support and resistance levels of the price of a cryptocurrency. This shows if the price of the cryptocurrency has dropped lower (support) or has moved higher (resistance).
Some indicators also help in determining the future price of a cryptocurrency. It also helps in placing upward and downward trends. This is very important for both cryptocurrency traders and cryptocurrency investors.
It is also a good tool for the analysis of cryptocurrency because it act as an alarm that alerts a technical analyst of major price actions or volatility.
HOW TO ADD INDICATORS TO A CHART.
To add indicators to your chart, you need to follow a few steps before you can get exactly what you want. The indicators available depends on the platform that you are viewing the chart, but most of the platforms are always having a wide range of these indicators.
Here are the steps to adding indicators to charts.
Step 1: Visit the platform that you want to check the chart and open the chart.
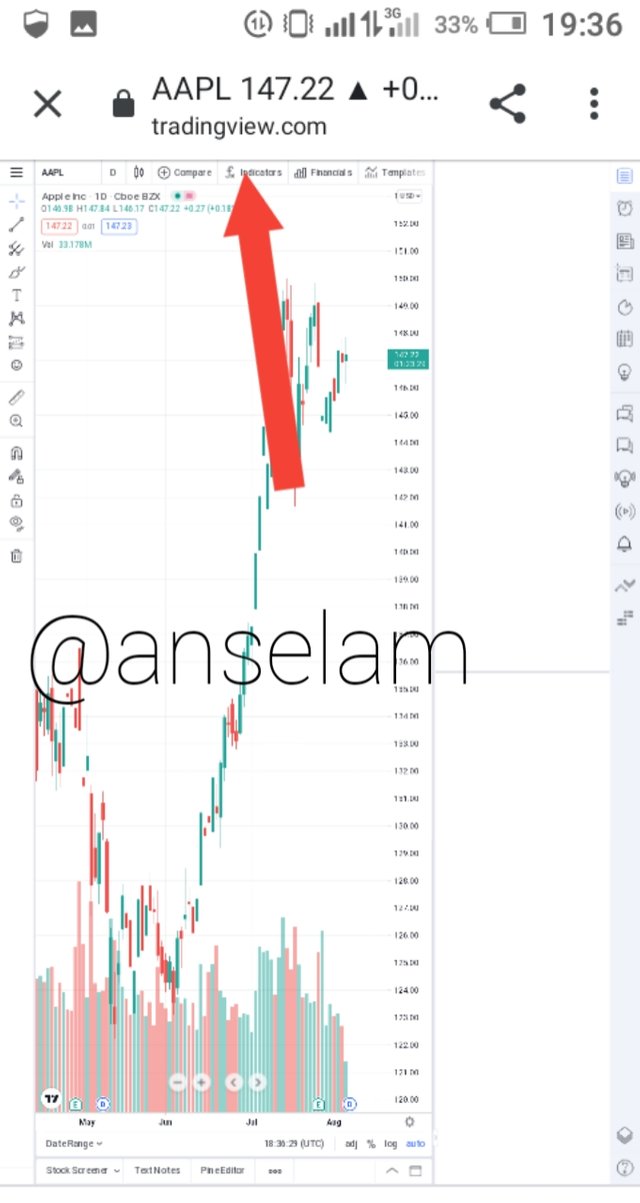
Step 2: At the top of the chart, you will see the tool bar. Locate "Indicators" and click on it.
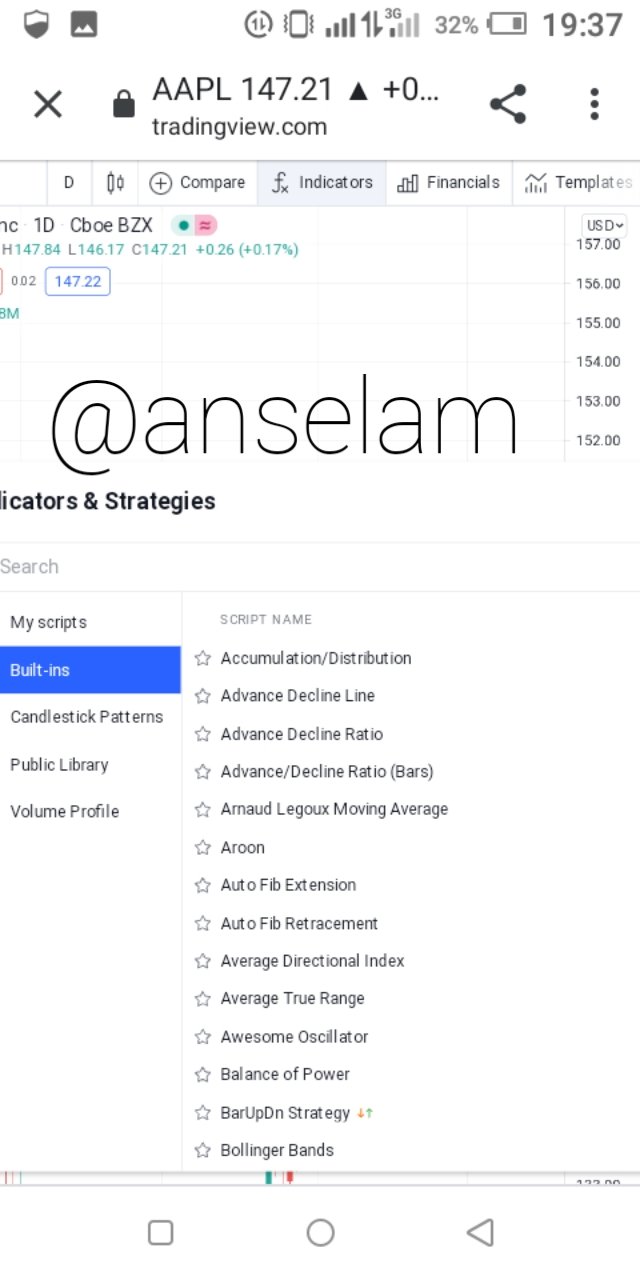
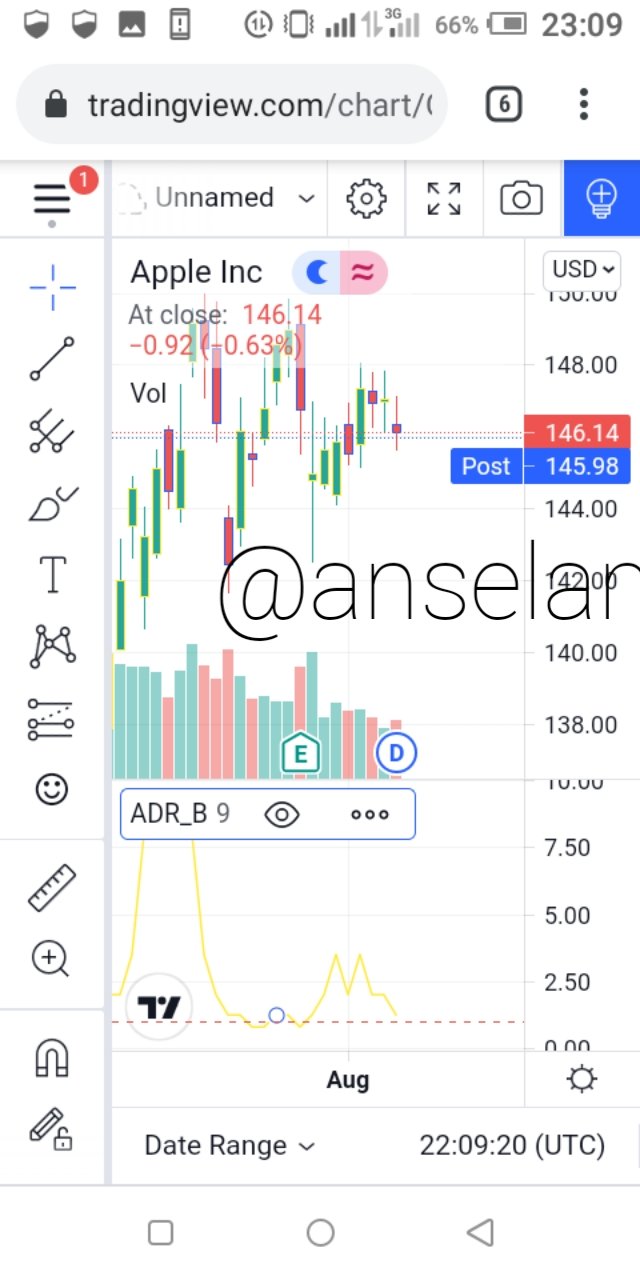
Step 3: You will be shown a mini page where you choose whether you want the built-in indicators or you want to pick from your script, the public library, the candlestick patterns and so on. As a beginner, you should pick from the built-in indicators. In my own chart, I have picked the Advance/Decline Ratio indicator.
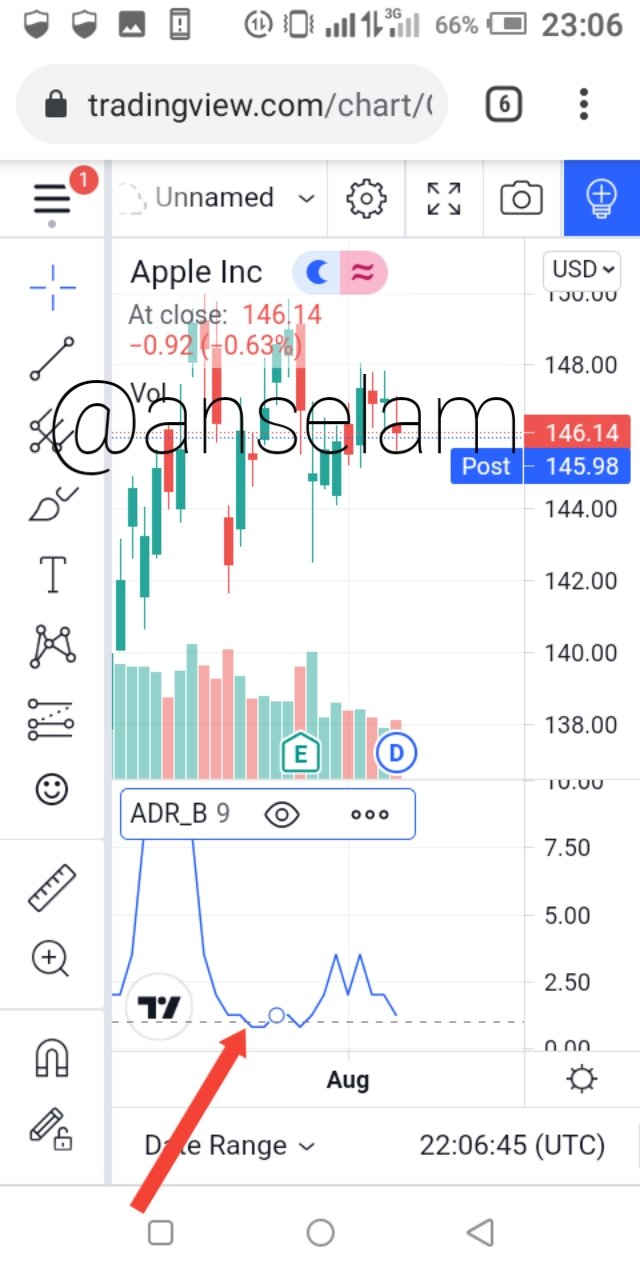
Step 4: After selecting the indicator of your choice, it will now be added to your chart.
HOW TO MODIFY AN INDICATOR
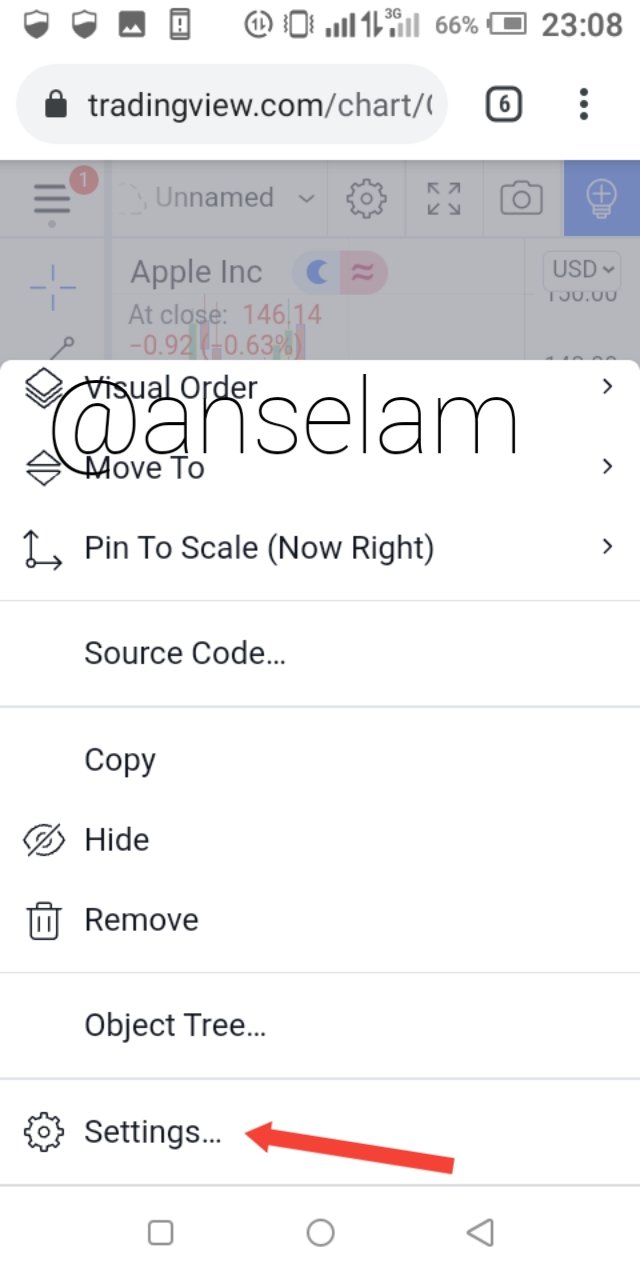
Step 1: Click on the three dots in the tool bar of the indicator (it is always available near the indicator, but its exact position might vary).
Step 2: A page will pop-up for you to choose what you want to do, locate "settings" and click on it.
Step 3: You will now be taken to a page where you will modify your indicators, after the modifications you will click on "Ok".
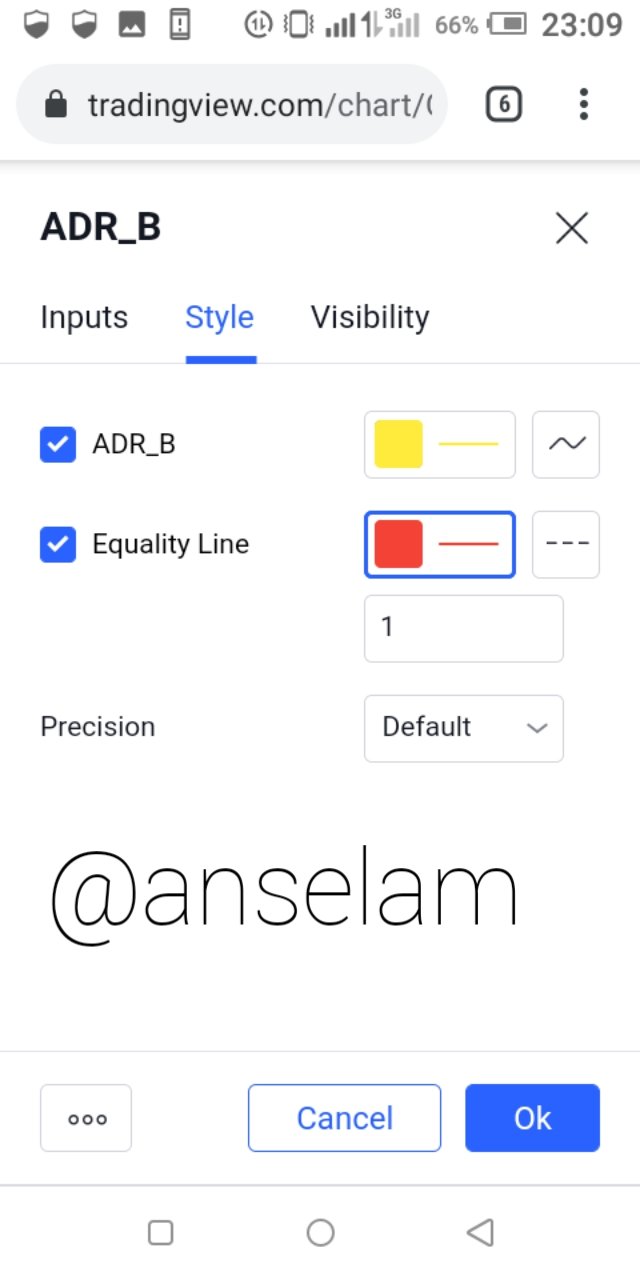
Step 4: Your indicator will now be modified.
THE DIFFERENT CATEGORIES OF INDICATORS AVAILABLE.
Trend Indicators;
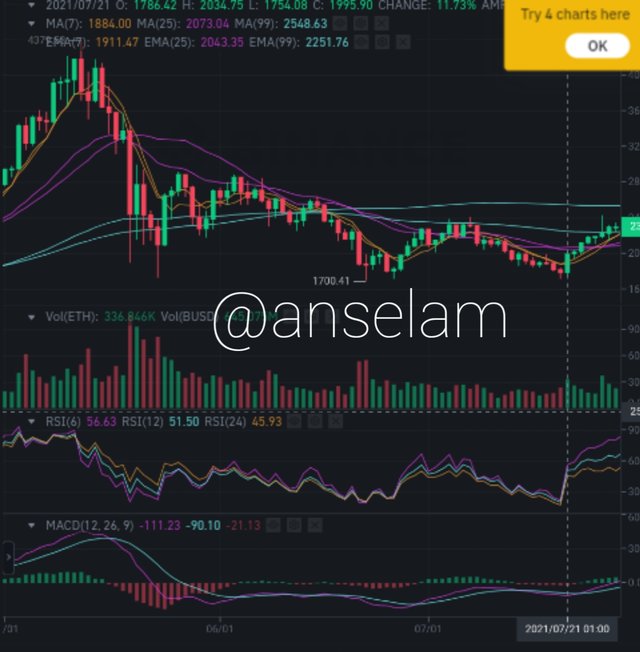
It is always an easy task to determine the price the trend of a given cryptocurrency pair or token just by looking at the chart of the price of the asset, but there are various indicators that are made to be used in identifying the current trend in the price of an asset.
These Indicators classified as trend indicators are very useful in the sense that they will help a trader in the same direction as that of the underlying trend, this is always one of the most profitable strategy. Again, they will also indicate a change in trend, which will help the trader to enter a right position at the start of the new trend.
The examples of trend Indicators include;
• The simple moving average.
• exponential moving average.
• Supertrend.
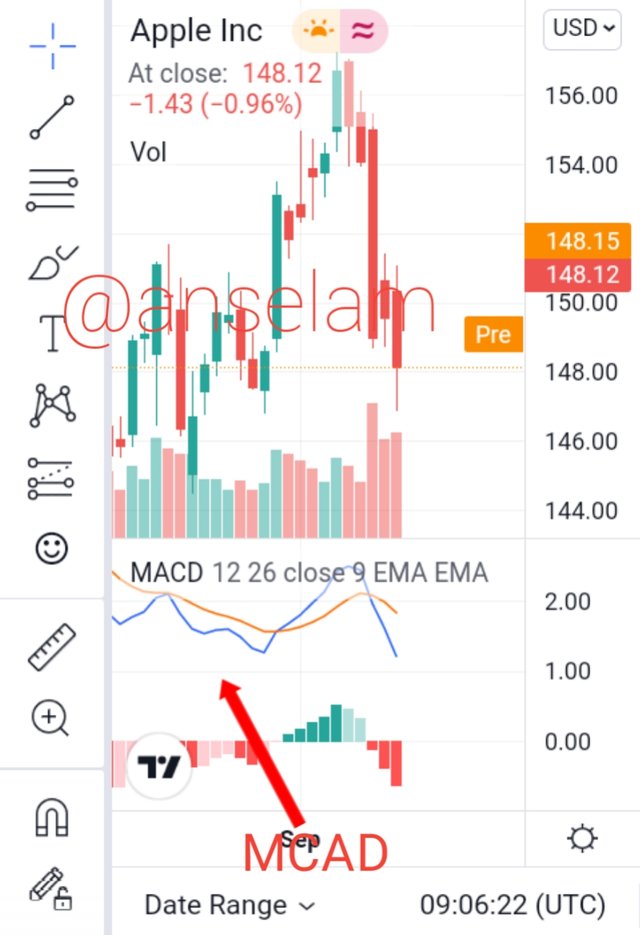
• MACD.
• Parabolic SAR indicators.
MOMENTUM INDICATORS.
The price of a certain cryptocurrency pair or any asset at all will always move upwards or downwards for long periods of time in what is termed as trends, but is always important to know the strength of a certain trend, this is the reason why momentum indicators are always very helpful.
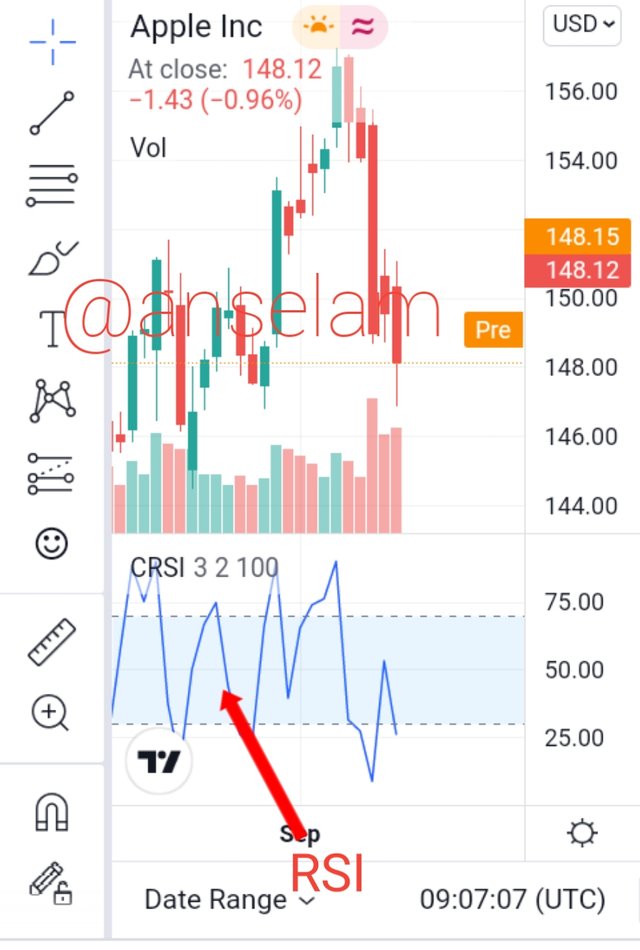
Momentum Indicators are known to always oscillate from the overbought to the oversold as the price of an asset rises and falls.
Despite the fact they are not always 100% reliable, momentum Indicators are always showing that the trend is beginning to run out of momentum and that it might be about to reverse once it enters the overbought or the oversold territory.
Examples of momentum Indicators include;
• RSI.
• Stochastics
• CCI.
VOLUME INDICATORS.
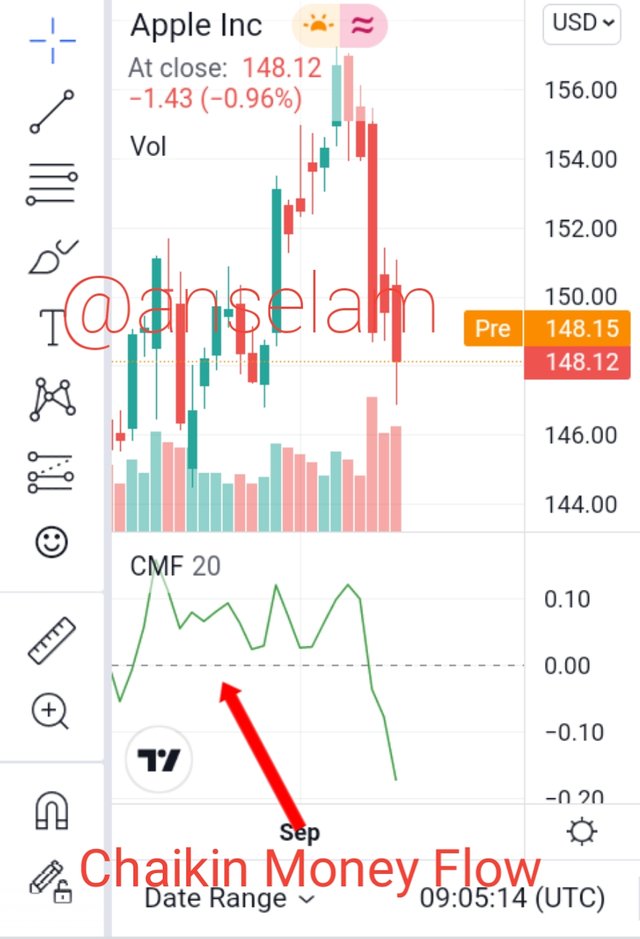
The Volume indicators are always used commonly by stock traders due to the fact that it is always hard to find the volume data for most individual currency pairs. So most investors looking for the volume of a certain currency pair might need to do some research to get the a charting platform that offers such.
Examples of volume Indicators include;
• Volume indicator.
• Chaikin Money Flow.
• On balance volume Indicator.
VOLATILITY INDICATORS
There are some times where the price of an asset or cryptocurrency pair is extremely volatile, thereby moving upwards and downwards. But there are some times where
the price seem not to be moving that much and thereby getting stuck in a narrow trading range.
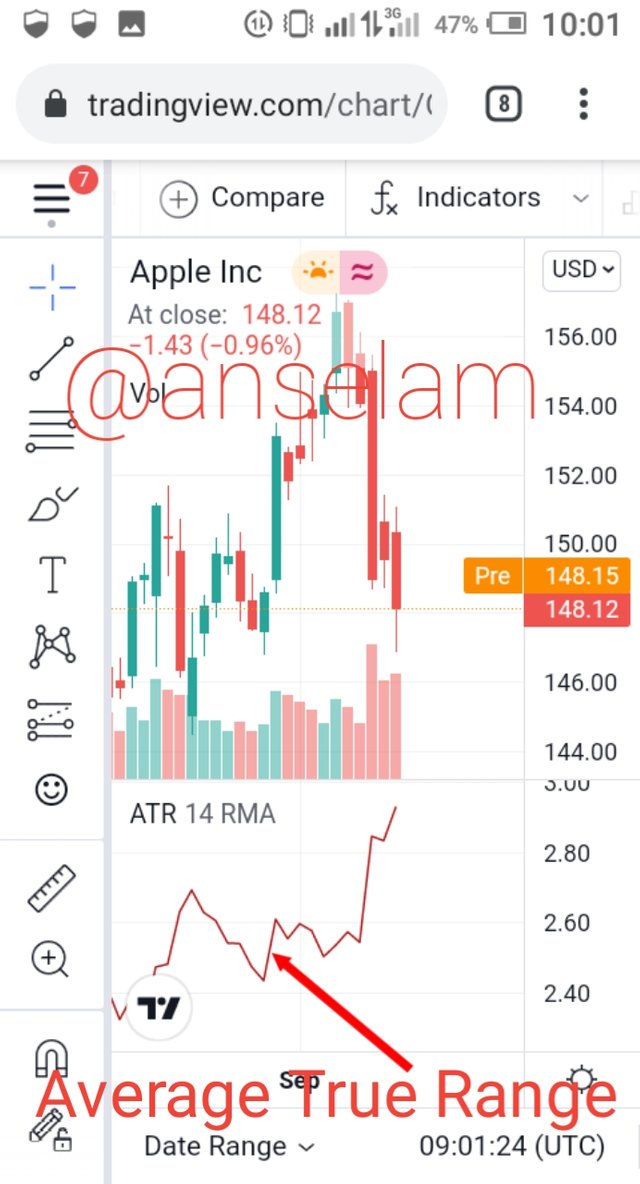
Sometimes it is very clear, but it is always important to use any of the volatility indicators get the a confirmed indication of the volatility of a particular asset at a particular time.
Examples of volatility indicators include;
• ADX Indicator.
• Average True Range Indicator.
WHY TECHNICAL INDICATORS SHOULD NOT BE USES AS STANDALONE TOOLS FOR TECHNICAL ANALYSIS.
All the technical Indicators take their data from the past and then the analysts try to project it into the future. The previous events or the digitalized trends of these Indicators can never be used to obtain a 100% probability clue of what might happen next. This is the reason why other factors should also be followed instead on using technical Indicators alone. Similarly, the technical indicators are always laging behind the present moment, but the market is known to be alive always and never waits for a single moment. So it is always taking a moment for an indicator to be certain on what to indicate on the chart, then it will now take another moment for a trader to make his/her decision on what do with this indicator chart. These two moments might be very short, but something can happen in the market within these moments to counter the representation that was obvious just a moment earlier.
This is why many other tools should be used when doing technical analysis and the analyst should not use technical indicators like standalone tools.
HOW A TRADER CAN INCREASE THE SUCCESS RATE OF A TECHNICAL INDICATOR SIGNAL.
For a trader to increase the success rate of a technical Indicator, the trader must avoid some things like "Multicollinearity", this is a technical term that is used to describe the act of multiple counting of the same information. This is a very common issue in technical analysis, it always happen when the same types of indicators are used in one chart. It ends up creating redundant signals that might get to mislead the trader.
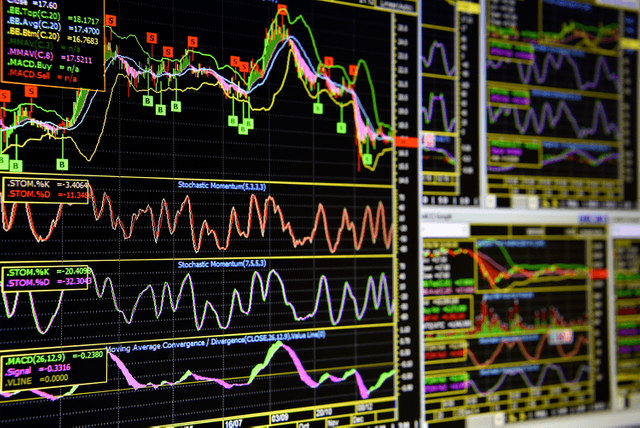
The trader should also avoid information overload. Many traders are fun of using multiple monitors in order to display several charts and also order entry windows. Even if the trader should use up to six monitors, it should not be seen as a very good thing because the trader will eventually become lost.
The trader should create a workspace that is well organized and he/she use only relevant analysis tool in the process. The technical indicators that the trader uses can be changed from time to time, based on the market conditions, the strategies used by the trader and the type of trading done by the trader.
Hello @anselam , I’m glad you participated in the 2nd week Season 4 of the Beginner’s class at the Steemit Crypto Academy. Your grades in this task are as follows:
Recommendation / Feedback:
Thank you for submitting your homework task.
I can see your post has paid out without getting curated by @steemcurator01. Please kindly repost with a screenshot of my review and also add repost in the title.
Thank you.