Crypto Academy / Season 3 - Week 8/ - Homework Post for professor @cryptokraze (Trading Sharkfin Pattern)
Hello guys, it’s final week of the Steemit crypto academy and in this week’s lecture, professor @cryptokraze prepared a lesson on the topic Trading Sharkfin Pattern. After reading the lecture notes and doing some research about the topic, I’ve decided to attempt the assignment tasks that was given.
 canva
canvaQ1: What is your understanding of Sharkfin Patterns. Give Examples
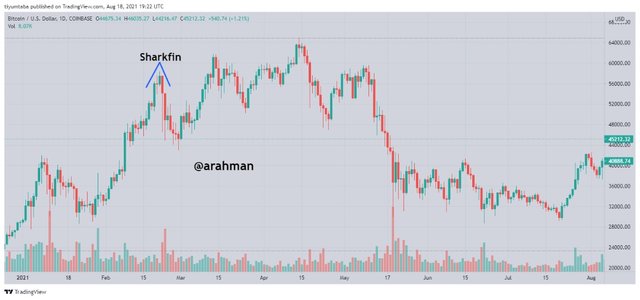
The Sharkfin Pattern is the shape that is formed from the downtrend and uptrend price reversal of a crypto asset chart. The formation of this pattern can be used to detect or anticipate the early stages of a bullish or bearish period and this will help traders to gain more profits with the use of this strategy for technical analysis.
Sharkfin Pattern forms a V-Shape in the chart when there is a price reversal of an asset. In simple terms, the reversal of a downtrend will move to an uptrend in the chart which will then form the V-shape.
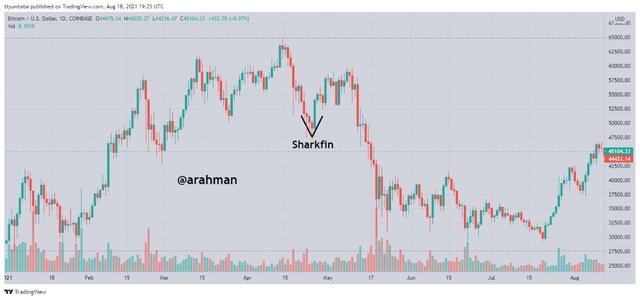
Also, the reversal of an uptrend in a chart of an asset will form an Inverted V-shape which means the price of the asset under study has shifted to the opposite direction. Hence the price of the asset is going bearish.

Q2: Implement RSI indicator to spot sharkfin patterns.
In general, it always advisable to use two or more methods in technical analysis in order to obtain accurate results before trading.
In view of this, the Sharkfin Pattern can be used together with RSI Indicator to confirm the results from the Sharkfin Pattern.
RSI levels are set at the default of 70 and 30 and then we observe the overbought and oversold region. After observing the Sharkfin Pattern in the chart, we can confirm it by comparing it with the information from the RSI indicator, thus the corresponding overbought or oversold region in the RSI Indicator of the chart.
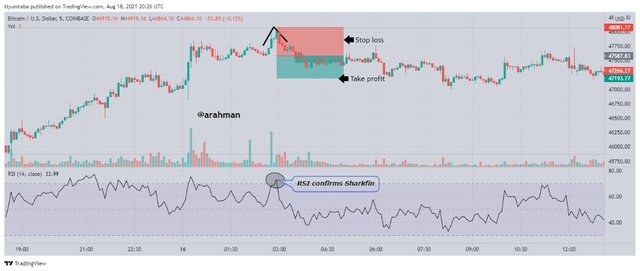
For this demonstration, I will use a chart of BTC/USD from TradingView website.
So I launched a chart and added the RSI indicator to the chart and made the following observations and analysis:
Uptrend Reversal
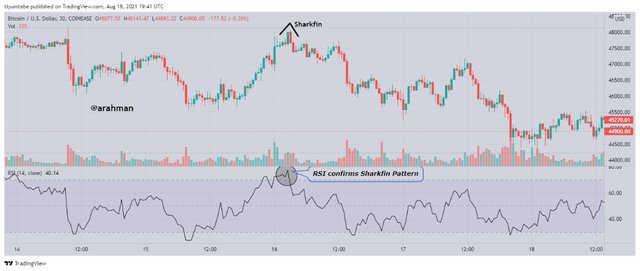
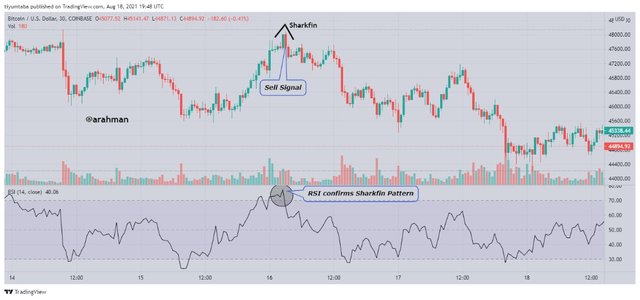
For an accurate Sharkfin Pattern to appear on a chart of an uptrend reversal, the RSI should go above the 70 mark. Immediately it is above the 70 mark, it will quickly reverse below 70 mark and this will form an overbought region. Accounting for the inverted V-shape that appears in the chart.

Downtrend Reversal
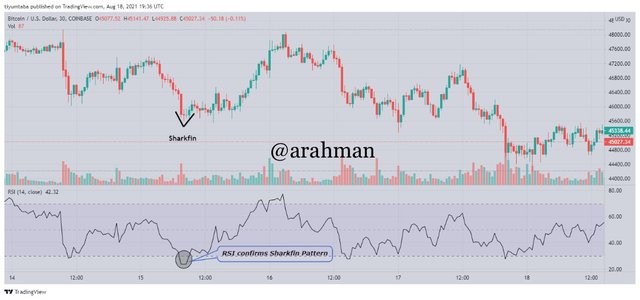
A Sharkfin pattern will appear on a chart of a downtrend movement reversal when the RSI enters below the 30 mark. There is a quick price reversal of the asset after entering below the 30 mark and then it moves sharp back above the 30 mark. This will cause a formation of an oversold region in the RSI Indicator and hence accounting for the Sharkfin V-shape pattern in the chart.

Q3: Write the trade entry and exit criteria to trade sharkfin pattern
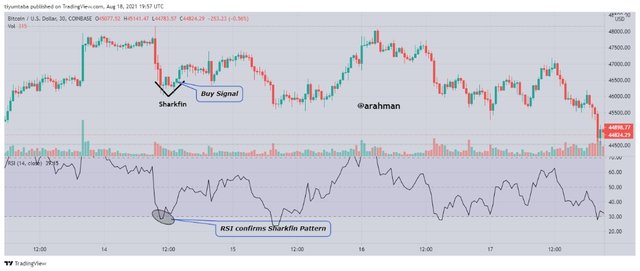
Entry Criteria For Buy Position.
Launch a chart and add the RSI indicator with default settings of 70 and 30 levels.
Observe the chart and look out for a V-shape formed from a quick downtrend movement to quick shift to uptrend.
Confirm this Sharkfin Pattern by comparing with the RSI indicator. Observe the RSI indicator and see if it has gone below the 30 mark and quickly reversed to move back above the 30 mark.
Place your Buy order when you’re 100% certain that the RSI has risen above the 30 mark.
Entry Criteria for Sell Position
Again, launch a chart and add the RSI indicator with default settings to the chart.
Observe the chart and look out for an inverted V-shape formed from a quick uptrend movement to a quick shift to a downtrend.
Confirm this Sharkfin Pattern by comparing with the RSI indicator. Observe the RSI indicator and see if it has gone above the 70 mark and quickly reversed to move back below the 70 mark.
Finally, Place your sell order when you’re 100% sure that the RSI has dipped below the 70 mark.

Exit Criteria For Buy Position.
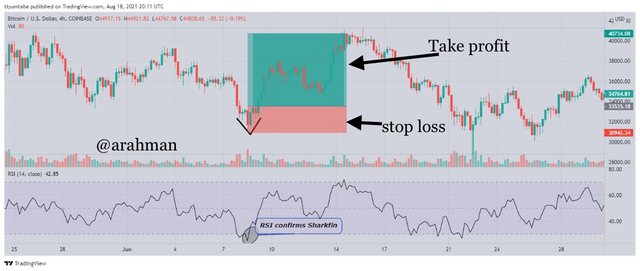
It is advisable to set a Stop Loss Level to prevent losses in case the trade goes in the wrong direction after entry. The Stop loss level should be set below the swing low point of the sharkfin pattern.
Take profit should also be set for at least 1:1 RR(Risk : Reward)
When the price crosses the stop loss levels, it means the trade going to be invalidated and the trade should be exited then place a different order.
But when price crosses your take profit levels, you can collect the profits and exit from trade if you wish.
Exit Criteria for Sell Position
Again,It is advisable to set a Stop Loss Level to prevent losses in case the trade goes in the wrong direction after entry. The Stop loss level should be set above the swing low point of the sharkfin pattern.
A Take profit should also be set for at least 1:1 RR(Risk : Reward)
Finally, when the price crosses the stop loss levels, it means the trade going to be invalidated and the trade should be exited then place a different order.
But when price crosses your take profit levels, you can collect the profits and exit from the trade if you wish.

Q4: Place at least 2 trades based on sharkfin pattern strategy (Need to actually place trades along with Clear Charts)
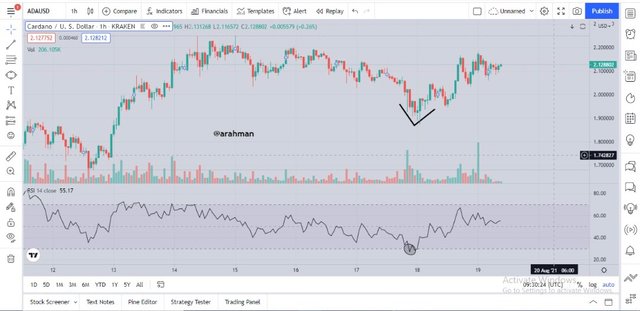
Buy Oder for ADA/USD
- I opened the chart for ADA/USD chart and added the RSI indicator with default settings.
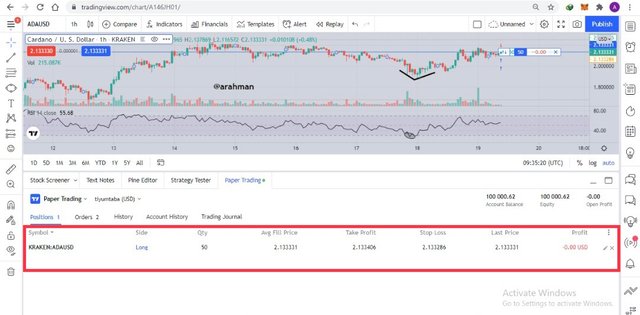
- Placed an order of 50 ADA, take profit at 75($2.134205) and stop loss 45 ($2.134085).
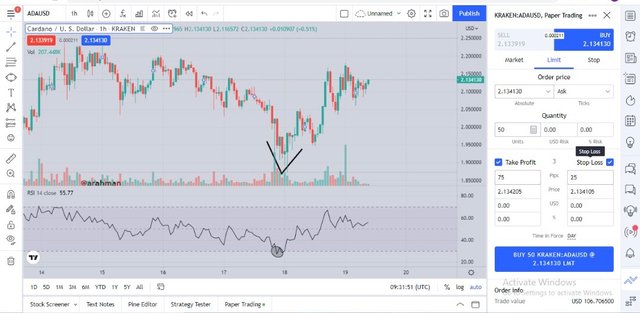
- The Oder was placed as shown in the image below:

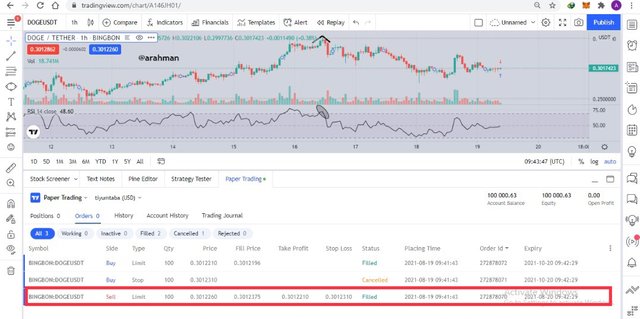
Sell order for DOGE/TETHER
- I opened a chart for DOGE/TETHER pair and added the RSI indicator, set the time frame to 1 hour.
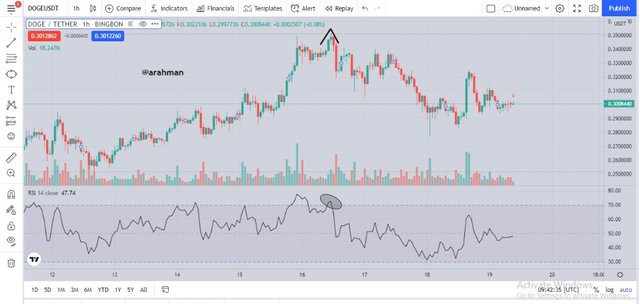
- Opened a trade of 100 DOGE sell order with Take profit at 50 ($0.3012210) and stop loss 50 ($0.3012310).
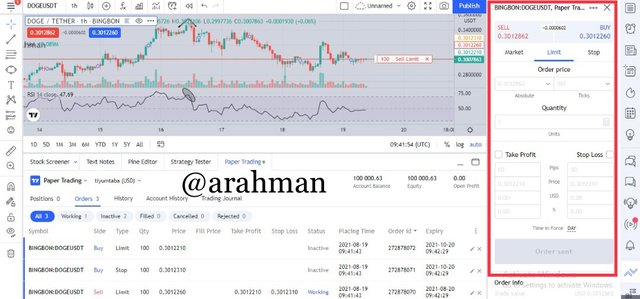
- My sell order was placed as shown in the image below.

Conclusion
The Sharkfin Pattern can be very useful in addition to trading experience, and just like other methods of technical analysis it should be used with at least one another indicator or method to confirm it’s results.
The V-shapes tells us in that there is an oversold or overbought zone formation if we use the RSI indicator. From my study, I think the the Sharkfin pattern works well together with the RSI indicator.
It is always essential to set Stop loss and Take profit anytime you’re using the Sharkfin Pattern for any trade. This will help prevent huge losses and improve profits from trades.
Thank you professor @cryptokraze for a very important lesson, I hope to continue with you next season.