Crypto Academy Season 3 Week 7 Homework Post for @yousafharoonkhan Submitted by @awakpasnas
This time, I want to make a homework post that will answer professor @yousafharoonkhan from Steemit Crypto Academy, as the homework is to answer some questions given by our professor.
[A] Defining the TradingView site and how to register an account in tradingview? what are the different registration plan?(screenshot necessary)
The TradingView website is a website that gives its users access to all trading charts, charts that can mean stock charts, forex, gold and of course it provides cryptocurrency charts. By using charts in TradingView we can do analysis with charts in trading views. As we know that charts are a very important tool for making profit in asset trading. Because in the charts there are different strategies in trading and interestingly we can get all charts of all types of trades in Trading View.
TadingView which is a platform that provides trading charts, this website has high ratings and is very often used by traders. And what's even more great is that traders' data will be protected because TradingView upholds privacy. There are more than hundreds of supported trading markets and various trading tools on this website.
Register an account on TradingView
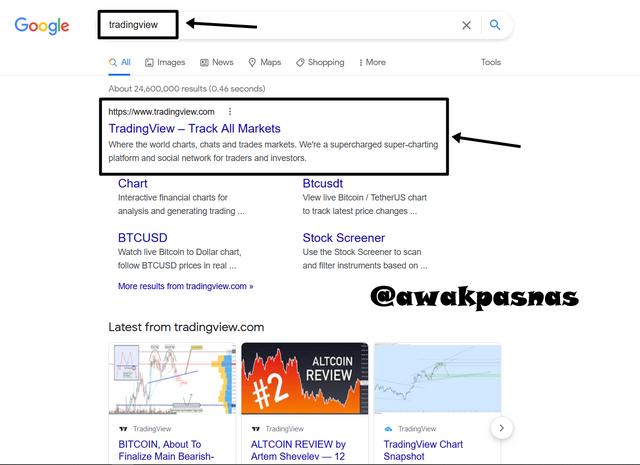
To register an account on the TradingView website, the first thing you have to do is search for the TradingView website on Google and then click on the top website.
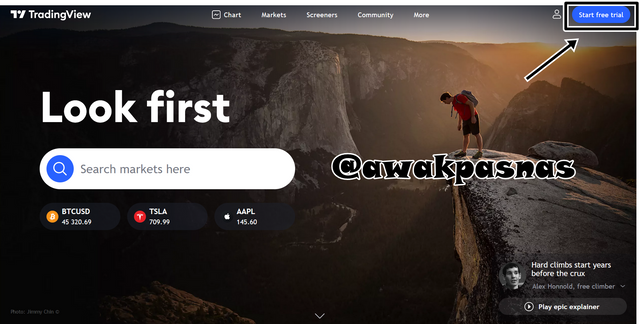
After that select the free trial start menu at the top right corner of the TradingView start page.
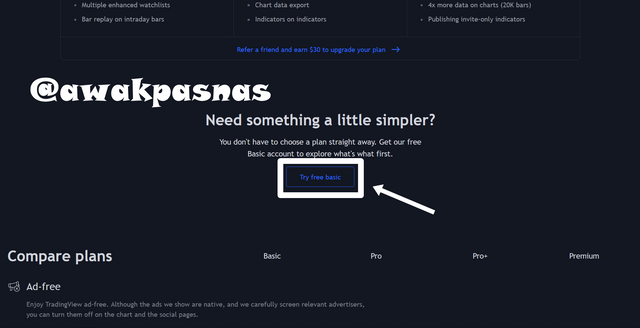
Scroll to the bottom of the page until you find try free basic. Choose that option.
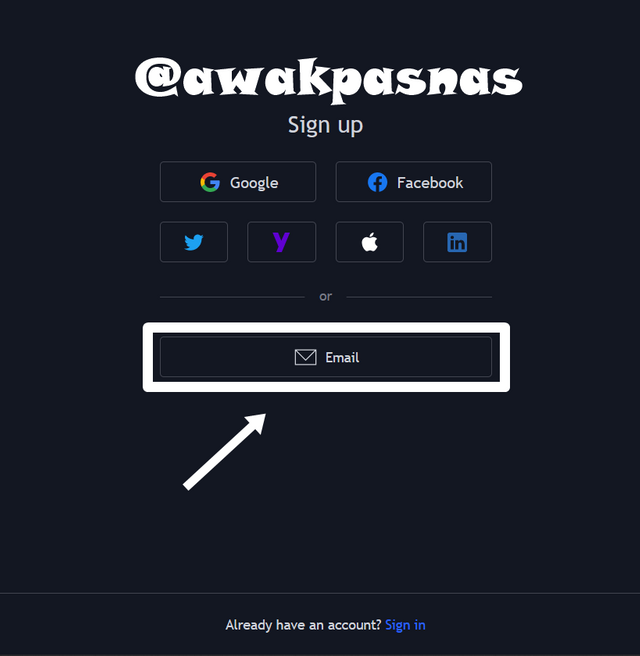
Then we will sign up, there are several options given but this time we will choose the easy one, namely via email.
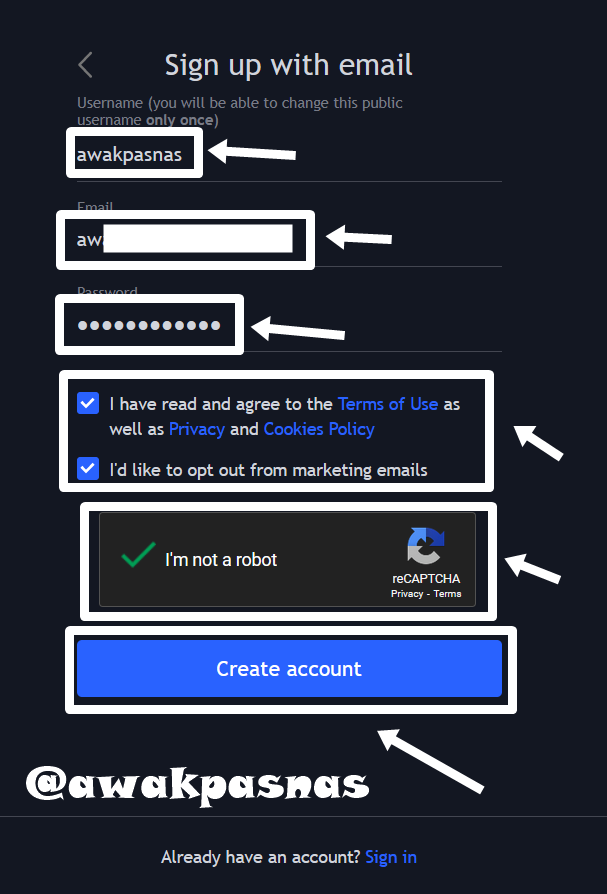
Then you will be asked to enter some data such as your username, the email you use, create a password, etc. After that, all you have to do is click create an account at the bottom.
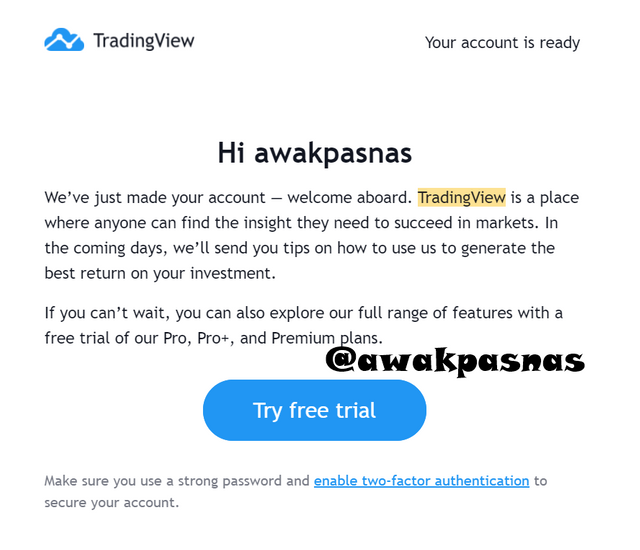
Finally, we will verify the email that we have registered, after the email verification is complete, a new email will appear telling us that the verification process is complete and our account can be used.
Registration Plan on TradingView
The registration on the TradingView website has several different types of plans. The types of plans offered include: Pro, Pro+, and Premium. And each plan is divided into 2 payment options, including monthly payments or annual payments, while the details for the plans on TradingView are as follows:
1. Monthly payment
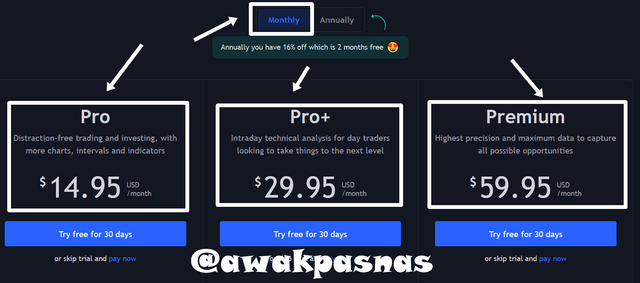
- Pro = 14.95 USD
- Pro+ = 29.95 USD
- Premium = 59.95 USD
2. Annual payment
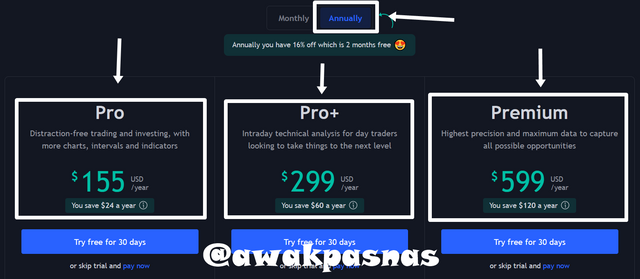
- Pro = 155 USD
- Pro+ = 299 USD
- Premium = 599 USD
[B] Explain the different features of tradingView and what is your favorite feature and why?(screenshot necessary)
There are several features that TradingView provides to its users, these features can be seen on the start page of TradingView as shown in the image below.
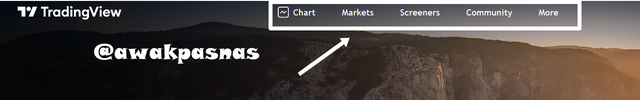
Its features include:
1. Charts
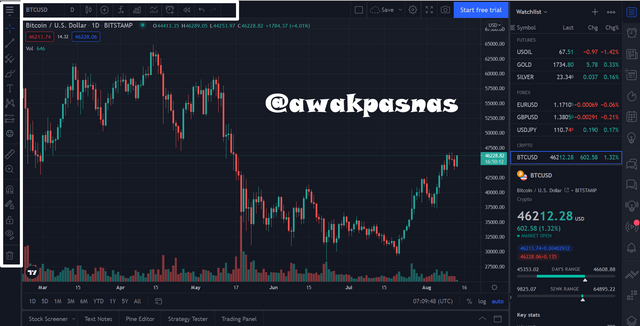
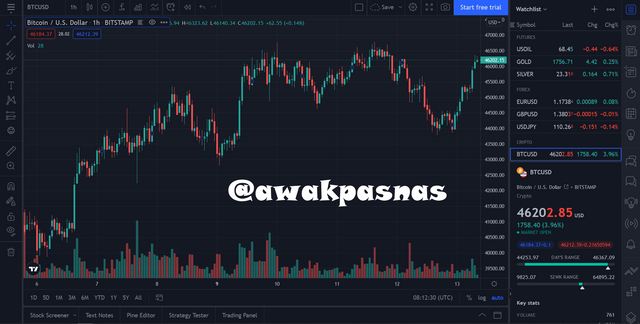
In this feature we will be given a graph of the asset we want to see, for example in the picture above I am looking at a Bitcoin chart. In this feature, users are given the flexibility to add anything to the existing graph. Users can add helplines for trendlines, indicators, take profit and stop loss levels, etc.
2. Market
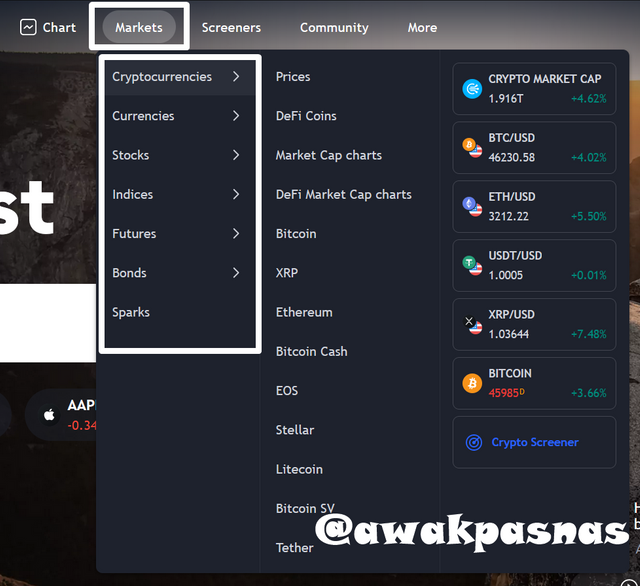
Next is the market feature, in this feature we are given several market options provided by TradingView such as cryptocurrencies, fiat currencies, stocks, etc. which you can see in the image below.
3. Screeners
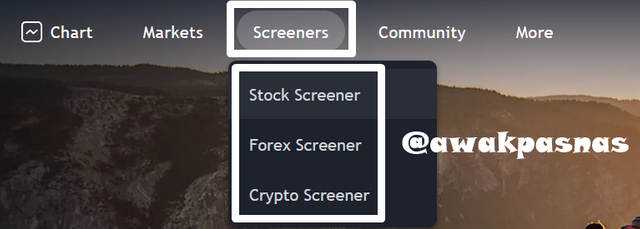
Screeners is a feature that gives TradingView users the flexibility to monitor an asset with the desired criteria. In TradingView there are 3 types of assets that can be entered on screeners namely stocks, forex, and cryptocurrencies.
4. Community
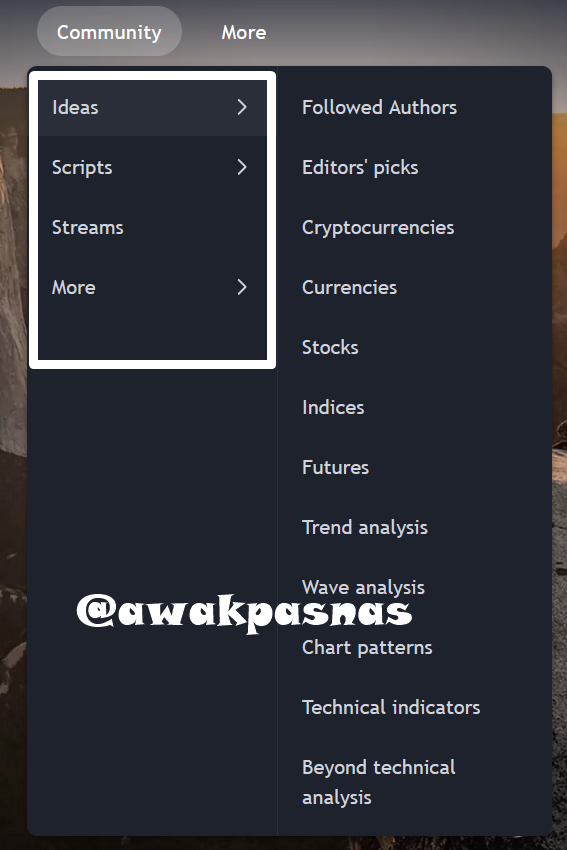
In this section you will be given several options namely ideas, scripts, streams, and more. For example in the Idea section you can see several features such as Followed Authors, Editors' picks, etc.
5. More
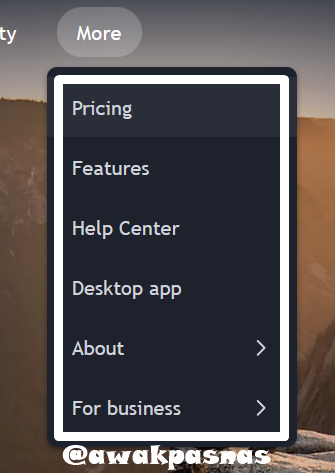
This is the last feature in TradingView, this section is where other features that have not been discussed are included.
My favorite feature on TradingView
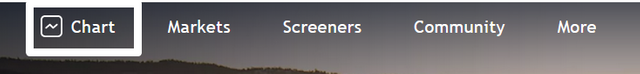
With the many features available in TradingView, it makes me confused which one to choose, but because the professor told me to choose, I will choose the chart feature.
I think this feature is the most important feature that causes a lot of people to use TradingView. Because traders really want real-time price updates for an asset and in TradingView we can see a chart of an asset even with a 1 minute timefame. Then in this feature we are given the flexibility to add anything directly to the chart, so that it will make our trading experience even better.
[C] How to set up a chart in TradingView and use two tools to edit it. (screenshot necessary)
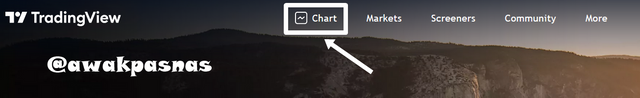
Setting up a chart on TradingView is very easy. First, you just need to select the Chart feature on the TradingView start page.
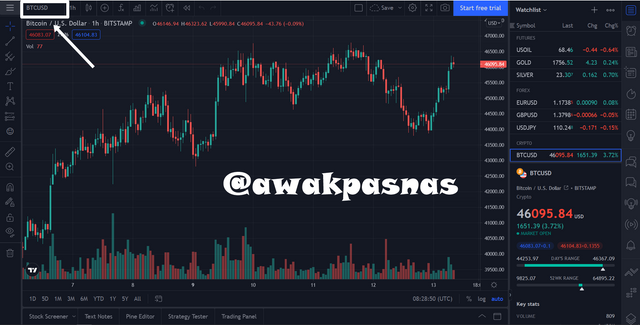
Then you will be given an example chart, to change it you just select the name of the market chart at the top right of the chart.
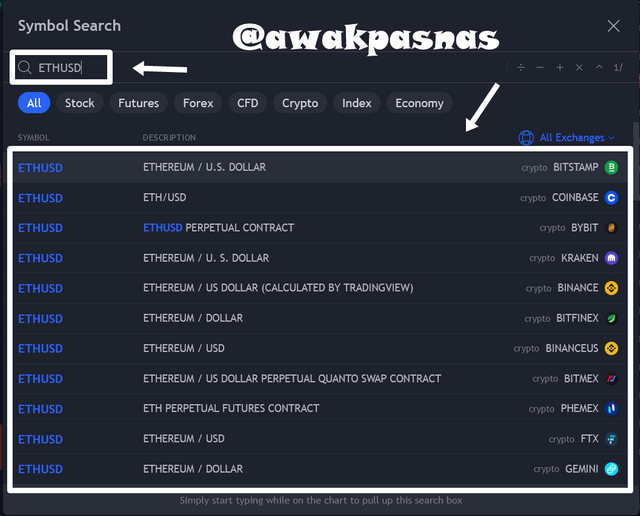
After typing the name of the asset you want to search for, like here I want to find the ETH/USD chart, after that all the ETH/USD markets on various exchanges will appear, you can choose as you like.
1. Change the chart type
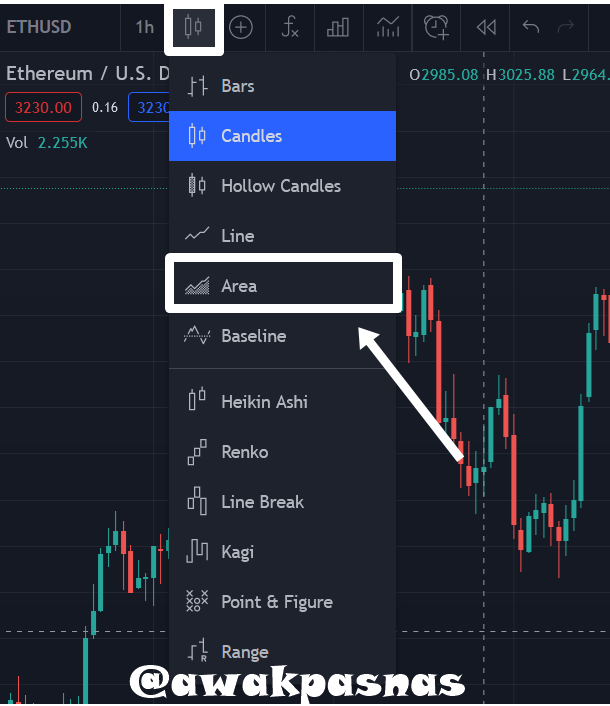
As we know that the default chart type shown when we open TradingView is Candlestick, but you can change the chart type as you like. You just need to choose a tool with a candle at the top, then after that you will be given several choices of chart types such as Bars, Candles, Hollow Candles, etc. In this example I will choose to convert the candlestick chart to an area chart.
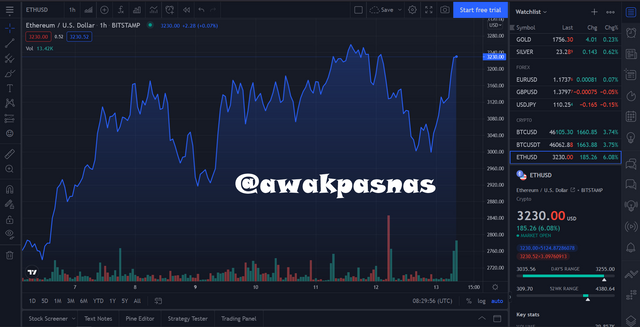
You can see in the image below, after I selected the area chart, the chart type shown on TradingView also changed to an Area-type chart.
2. Added trendline
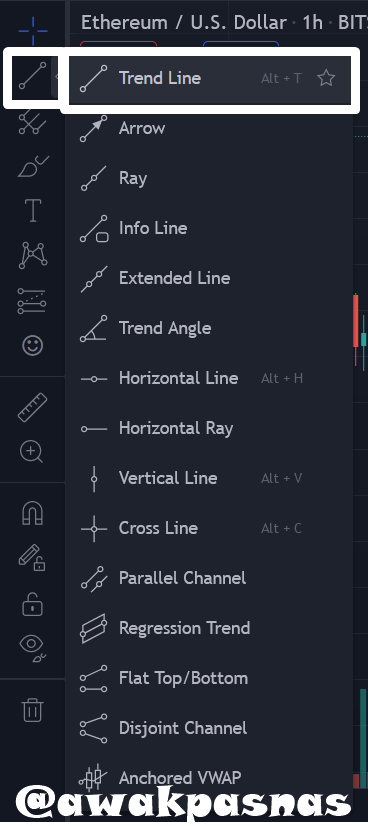
There is one more tool that I think is important for many people to know, this tool is called Trend Line. To add this tool, we just need to select an option with an image such as a line on the left of the chart, after that a variety of line tools will appear offered by TradingView, after that select the Trend Line at the top.
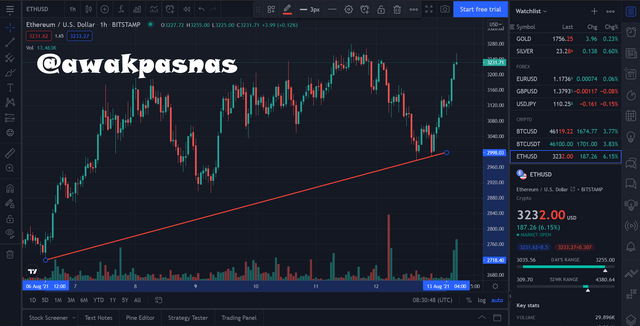
After that you are free to draw the trend line as you like, the example below shows how to use the trend line as a support line for the ETH/USD chart, after the line is drawn accordingly, we will be able to see how long the line is and we can also see how much the price increase from the support line that we have made.
[D] Explain how to add indicator in chart, what is your your favorite indicator and why? (screenshot necessary)
This time I will show you how to get indicators on charts in TradingView, the indicator I chose is Moving Average Convergence Divergence (MACD).
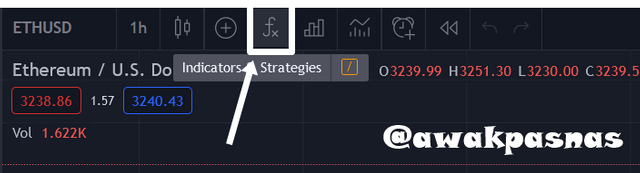
The first step is to choose the tool indicators and strategies that are above the graph.
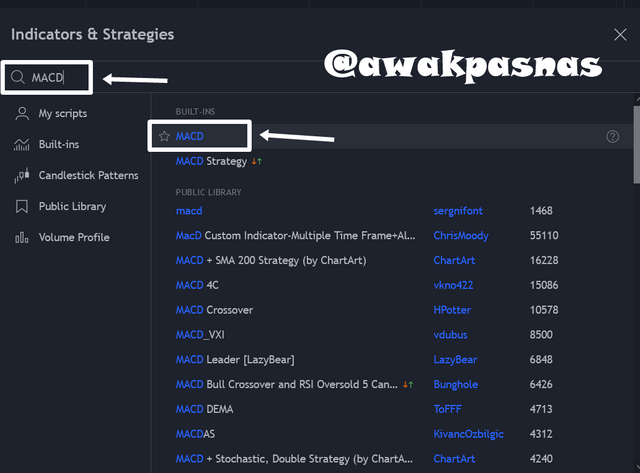
After that look for the indicator that we want to add to the search column, here I search for MACD and choose the indicator that is at the top.
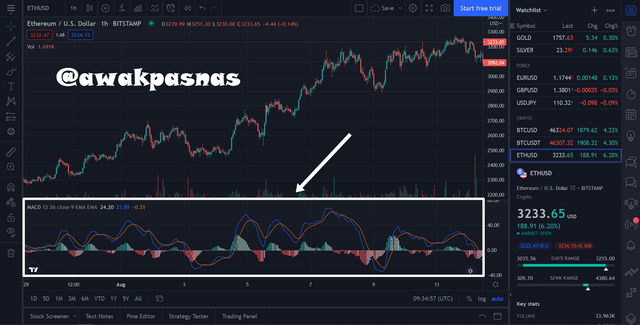
After that the MACD indicator will appear at the bottom of the chart which looks like the picture below.
Reasons for choosing MACD
The reason I chose the MACD indicator is very simple, that is by using this indicator we can determine when to enter a trade and when to exit. This can happen because MACD gives us signals that we can use as a benchmark for trading.
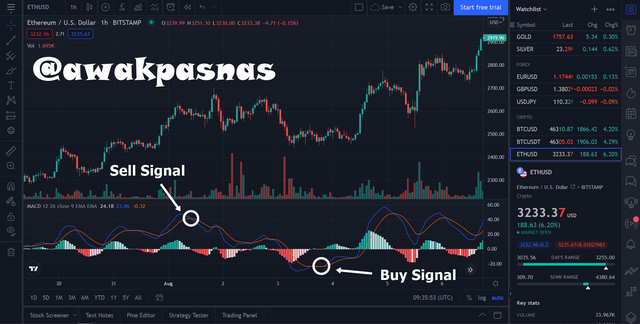
This signal is formed when there is a cross between the 2 EMA lines on the MACD indicator. As in the picture above you can see in the sell signal that the blue and red lines intersect each other which results in the blue line being below the red line, this indicates that the market price will experience a decline. Conversely, if the red line is below the blue line, then it indicates that the market price will increase which makes it a signal to buy.
[E] Do you think TradingView is useful in predicting the market for cryptocurrency (trend / price)?
I would say that TradingView is a very useful website for predicting the price movement of an asset. We can view all charts of each asset in any timeframe we want. TradingView is a platform that is often used by all traders related to all financial sectors.
Trading View is very helpful for traders in predicting market price movements. Then on this website we can freely add supporting indicators that will be very helpful in predicting market trends. Indicators such as MACD, EMA, MSB, etc. are very important in predicting market price movements, especially in a relatively short period of time.
TradingView also provides various types of charts that we can use in our analysis such as area charts and candlestick charts that we can choose freely. With all the features offered by TradingView, this platform is used by almost all traders in the world, because of its accuracy in predicting market trends and other things that make traders very comfortable using TradingView.
[F] Conclusion
TradingView is a very useful tool in the world of trading, with this tool it helps many people to trade on any type of asset and most importantly this website can be accessed for free and 24 hours a day. With the various features offered, TradingView deserves to be said as the best website in the world of digital asset trading.
Thank you for reading my blog, hope it will be useful for readers.
I would also like to thanks professor @yousafharoonkhan for creating such an excellent study like this.
See you in the next post!!
Hi @awakpasnas
Thanks for participating in the Steemit Crypto Academy
Feedback
This is good content. Well done with your practical study on Tradingview.