Strategy and use of Donchian Channels - Crypto Academy / S5W1 - Homework post for @ lenonmc21
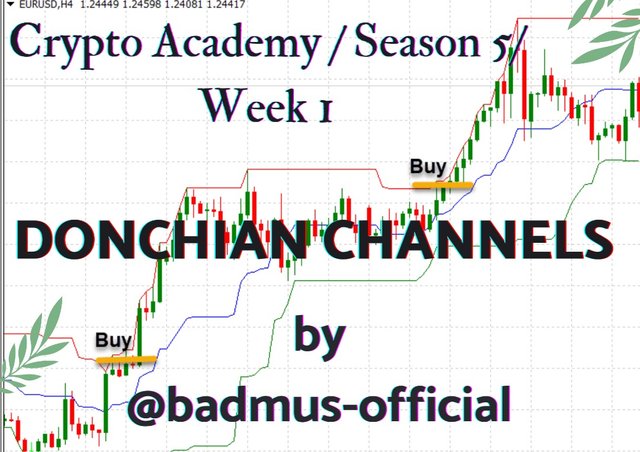
Hello everyone, welcome once again to the first week of the new season of the Crypto Academy class, kudos to professor @lenonmc21, as from the previous season we were able to learn a lot on trading analysis such as the Harmonic patterns, Trading Planning and so on. On today's task, I will be exploring with you the Donchian channel which is an indicator, and as well I will be showing how to make use of this indicator for our trading strategy.. Read On!!

Explain and define in your own words what the Donchian Channels are?
The Donchian channel was a specialized indicator created by "Richard Donchian" a famous Trend analyzer also known as "Father of Trend". Richard Donchain develops the indicator during the twentieth century to assist him with distinguishing trends and analyzing market trends. The Donchain channel indicator is widely used today to assist traders in showing market instability, trend breakouts, reversal signals, and potential overbought/oversold market situations.
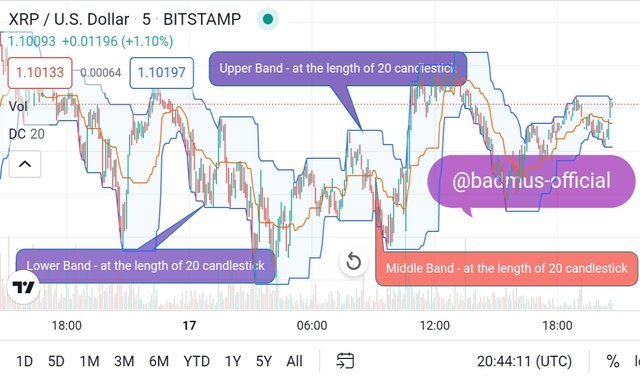
The Donchain channels compromise three lines produced by a moving average estimation including an indicator formed by Upper and Lower Band around a Middle-range. Notwithstanding, the region between the upper and lower band is the Donchain channel picked for the period. This was to assist traders with recognizing market trends in periods of time. The Donchain channel is as well common, and can mostly be found on most trading platforms.
Additionally, the Donchain channel ascertains its costs by utilizing a default 20 bars of candlestick. permitting, traders to utilize more limited or longer Donchian Channels as indicated by the trading platform.
In Summary, The Donchain channel makes it simple for the traders to distinguish bullish and bearish trends throughout that timeframe. Hence, traders can likewise utilize the Donchian Channel indicator to gauge the instability of the market and distinguish breakouts.
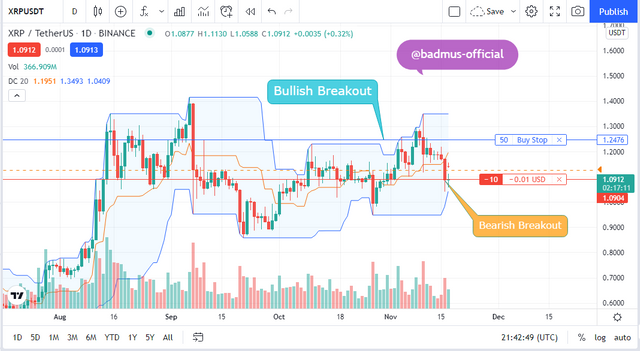
Illustration of the Donchian channel indicator on the XRP/Usdt chart below;

Explain in detail how Donchian Channels are calculated (without copying and pasting from the internet)?
The Dochian channel is generally determined in an extremely straightforward way. Despite the fact that, as prior referenced, its working ability depends on three bands that are plotted on the chart. The two of them are the most reduced low (Lower Band) and the most elevated high (Higher band) while the center band is sandwiched between the two bands. Here is a simple way to ascertain the donchain channels.
You should know that the donchian channel can be applied however duration a trader sees fit, it can be in seconds, days, or months.
where we have,
HH - To be the highest high in the last period minute
LW - To be the lowest low as well in the duration of minutes.
Then , we can have our Donchian channel to be calculated as DC = (HH + LH) / 2
With this calculation, we can confirm that the Donchian Channel (DC) is the average sum of our Highest high(Upper band) and lowest low (lower band) in the particular time period.
Note that, You can likewise pick any time span going from minutes to hours or days. Notwithstanding, recall that the best setting is to pick the time span and the duration you plan on making your trade.

Explain the different types of uses and interpretations of Donchian Channels (With examples of bullish and bearish trades)?
Just like have explained earlier in my article, where I made mention that the Donchian channel is used to analyze a market trend, as the indicator has 3 major components and these three lines can be used to show the market instability, trend breakouts, reversal signals, and as well the potential overbought / oversold of the market situations.
The Donchian Channel compromises of three bands which are ;
The upper band - the band which shows the most excessive price of the market in the past period.
The lower band - the band which shows the least cost of the market in the past period.
The Mid-range Band - which shows the average price of the upper and lower band.
Next, I will be giving an analysis on the use of the Donchian Channel
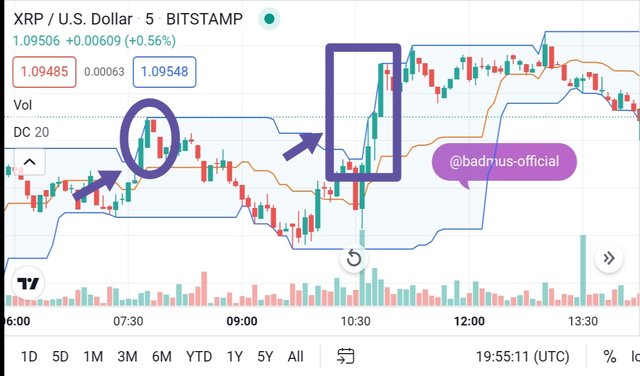
- Identify Bullish signal:- The Donchian Channels can be used to identify a bullish signal On the off chance that the market price is trending towards the upper band, this might flag a bullish trend, which thus signals that the market has currently been overbought.
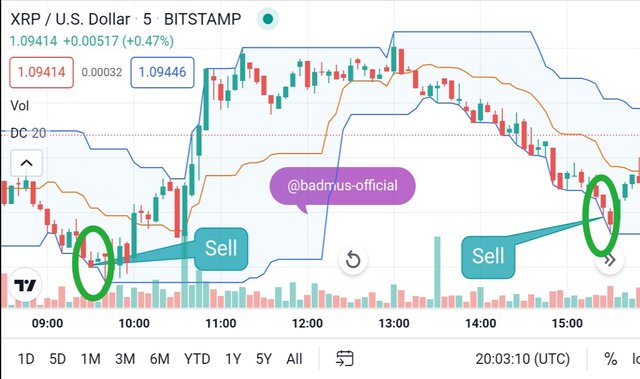
- Identify Bearish signal:- The Donchian Channels can as well be used to identify a bearish signal in the occasion that the market price is trending towards the Lower band, this might flag a bearish trend, which thus signals that the market has currently been oversold.
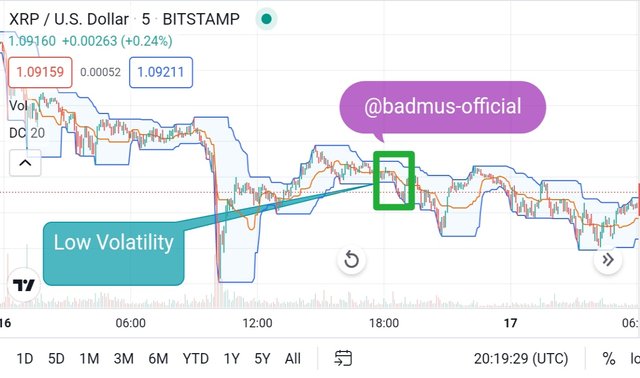
- Volatility:- The Donchian Channels as well Can be used to determine the market volatility as when the price developments are little and demonstrate low instability, the channel will be generally tight. Notwithstanding, in times of high volatility where the price varies exorbitantly, the channel will be somewhat wide.
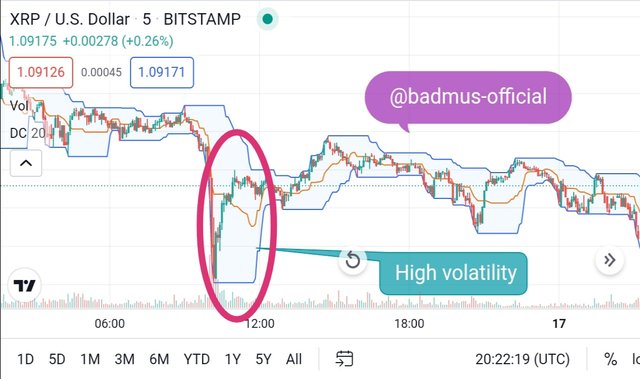

Practice (Remember to use your own images and put your username)
Make 1 inning using the "Donchian Channel Breakout Strategy" and make 1 inning using the "Reversal and Retracement Strategy" . You must explain the step by step of how you analyzed to take your entry and make them into a demo account so I can evaluate how the operation was taken
On this trading analysis, i will be showing illustration of how I choose to enter and exit trade using the Donchian channel Breakout strategy.
step1 I log on to tradingview platform and choose Paper Trading as my demo platform, I then proceed to choose the Donchian Channel as my indicator, setting the indicator to 20 candlesticks
Step2: And, as well on my chart, I choose a timeframe of 15 days, which I could see clearly the trend activity in the past 15 days.
Step3: I then choose to enter the market when the market price was moving towards the Lower band, by placing a 10 xrp sell order
Step4: And I as well , set my buy limit order if incase the market price start moving towards the Upper band, so as not to miss out on the trade fortune.
Screenshot of my trade below;
I did the same two steps as I did in the breakout illustration mentioned earlier.
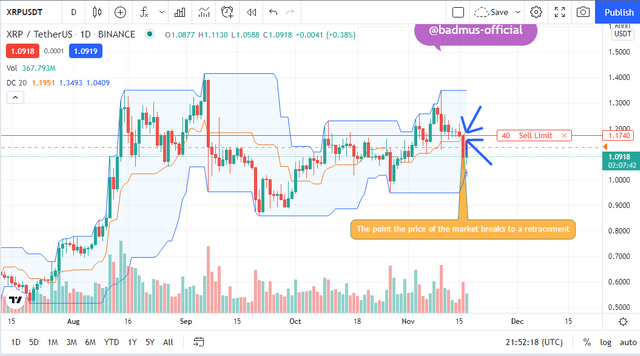
- Then I proceed to locate the mid-band point where the market price crosses to the lower band as the market is showing a reversal from the bullish trend, which I then use this analysis to take the advantage of the market and set an order to sold 50 XRP so as not to lose most of my asset to bear market and as well to minimize my risk.
Screenshot of my demo trade shown below

As prior talked about, the Donchian Channel indicator can be used to estimates the instability of the market and as well to determine the overbought or oversold of the market positioning.
It is well-advised to use the indicator alongside others, as one can not be too sure of making use of one. Thusly, exploit this indicator as it can function admirably with different indicators as well.
Thank you al all for following through on my post!!! Hope to see you in the coming task
Special regards : professor @lenonmc21
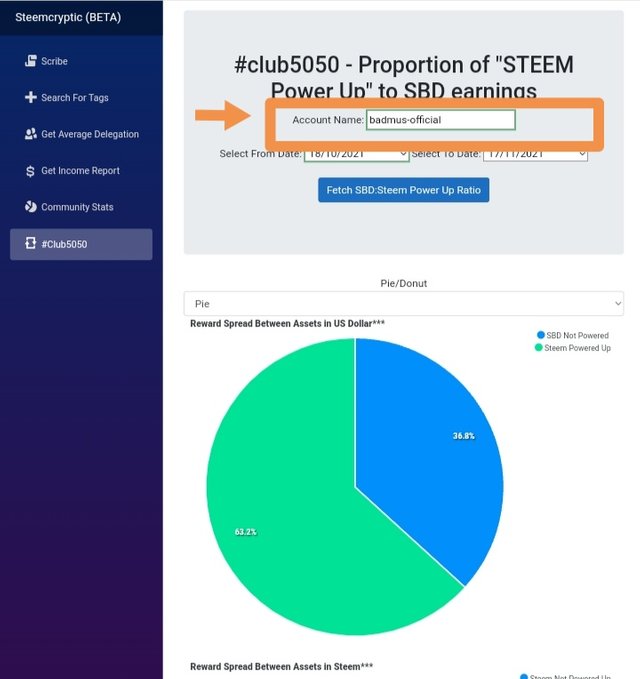
My club5050 as at the time of this submission was still very active as I have been able to power up 63. 2% of my payout in the last 30days.
