BrainMetric - IT’S STILL ALIVE!

Does anybody remember reading this?

No? Well I don’t blame you. It’s from THIS POST back on 5 August, so I hardly remember it myself!
In all seriousness, I didn’t forget about it, and I actually have been working on it (albeit at a rather low level) for the last four months. I want to reassure you that I still fully intend to finish it, though it’s going to take much longer than expected. This is it’s story so far...
A Brief History of BrainMetric
As you can see above, I described my metric as being “a quantitative metric used to determine the investor confidence of the market”. That’s no longer an accurate description of it.
The more I worked on it, the more I realised what else I could do with it by expanding upon it. I’ll spare you the details of the equations, partly to protect my own intellectual property, but mostly because equations tend to make people’s eyes glaze over!*[1]
I soon realised that my metric needed a benchmark. Finding a good benchmarks is trickier than it seems, because cryptocurrencies are anything but constant. They vary wildly in price compared to other asset classes, as well as to one another. Even a single cryptocurrency tends to have high price volatility. I reasoned that the best benchmark to have would be an aggregate of the combined data of all of the cryptocurrencies averaged over different time durations.
The trouble with that approach is that it is practically impossible to do. Wash trading wrecks it. Unlisted coins corrupt it. Delisted coin data are no longer readily available. Data anomalies (e.g. a spike caused by a data capture error) have a big effect on it. Even in a best case scenario it will only ever provide you with an approximation. With so much data and so many potential points of failure, it becomes a bad idea.
Big Data vs Little Bit Brain
The death blow to the “all coins” approach is the sheer amount of data it requires. Assuming the other issues can be resolved, I would still have to import, capture and process practically the entire historical database of a site such as CoinMarketCap or CoinGecko. CMC has got almost 4900 coins, CoinGecko (whose API I prefer to use) has over 6200! I’m working alone on this, and that amount of data is way too much for me to handle! Put it this way: Bitcoin alone represents about 15000 rows of data, each row being several columns wide! In fact, all I’ve managed so far is to process Bitcoin data.
But that’s fine. During this process, I have been able to plan my next steps, and have also found value in BTC data on its own.
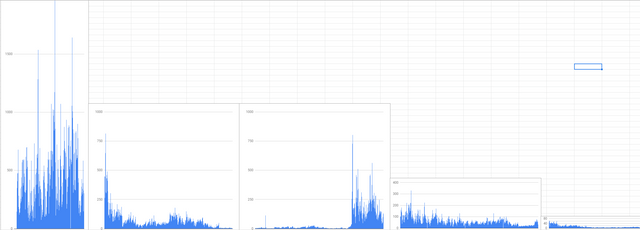
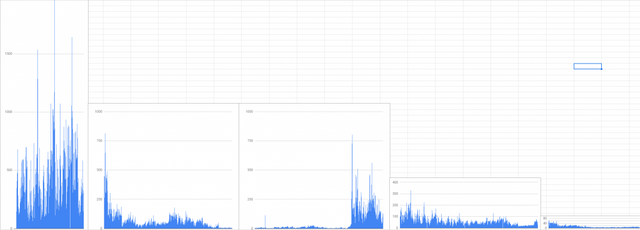
Analysis of BTC’s data processed through my most basic algorithm, reveals that it behaves much as as Bollinger Bands do (with similar predictive abilities). It is my hope that I will be able to calibrate the figures into a form of meaningful “market tension” indicator, an advanced warning sign of when some big price move is about to happen. Take a look at what I mean, this is the most basic form of BrainMetric data displayed in graphic form:

(Embarrassingly) Made by Bit Brain
Excuse the rudimentary charting, I originally made these strictly for developmental purposes, not for publishing! The aim of charting this was to determine how to use it as a benchmark. What you see above is basically how BTC trading activity (of which volume is only a part) changes over time. It’s a few months old, but you can notice that the far right side is already very “squashed” - much like the squeezing of Bollinger Bands. When I calibrate my data, this “squashing” will translate into a market tension; the more squashed it is and the longer it remains squashed, the higher the market tension figure will be.
Beyond BTC
I have decided that BTC will be my industry benchmark, it’s far easier working with one coin than with thousands! There is the option of using total market data, but this data is very hard to find for the early years and tends to be inherently corrupted by aggregation, lack of data and coins constantly being added to it. As a constant, it is very poor. It’s also interesting to note that you can’t use something like the “Top 10” coins, because while the names of those Top 10 may seem fairly constant, they change significantly over time. - making their data impossible for me to process.
I aim to be able to average my BrainMetic over time (in intervals of selectable duration for both macro and micro trends), and then compare it to the values of specific altcoins worked out using the same method. This will work in much the same way as we currently use BTC/sats price to benchmark the performance of different altcoins. Only, unlike with sats price, with BrainMetric the algorithms will allow us to compare apples with apples. You can’t say that e.g. DASH is better than TRX just because DASH has a higher sats price. But with BrainMetric you WILL be able to say that one is better than the other, since price will not be a primary factor.
“Better” is not the correct word, I think “less overbought” would be a more accurate description. BrainMetric will be similar to my 4 November post: “Perspective on Altcoins”, in which I used a pseudo-neutral metric (percentage drop from All Time High) to compare altcoins to one another. (Note: BrainMetric equations will not use ATH.)
Joining the Dots
At the end of the day I have a vision of what I want from BrainMetric, I want something that will show:
· The “Market Tension” of BTC - and maybe selected altcoins too.
· ... possibly graphically.
· A fair comparison between various altcoins to show which are undervalued and which are overvalued.
· The later incorporation of an additional metric which I have yet to develop.
BrainMetric will probably take the form of some sort of dashboard with a simple interface that hides all the background number crunching.
Yes, as the last bullet point states, there is a second metric in the pipeline. My brain laid yet another original idea egg that will tie in very nicely with my BrainMetric vision. So “BrainMetric” will probably become “BrainMetrics” as the second metric literally gets added into the equation. IF I can get it calibrated and start getting good predictive data from it, then the addition of the second metric will:
· Further help to determine “Market Tension” (i.e. how likely the next big jump will be), and
· (importantly) give percentage probabilities as to which direction that big jump will be in.
The second metric will operate on the principle of a rudimentary Kalman filter, calculating future jumps based on the frequency, sizes and directions of previous jumps. At this stage the second metric exists solely in my head, I haven’t had a chance to even start looking at the equation for it.
Making things happen
After deciding last year that Microsoft has got enough money, I stopped using Excel for my crypto-tracking spreadsheets. After trialling several free alternatives, I settled on the excellent FreeOffice suite for my day-to-day needs. (Visit www.freeoffice.com to check it out for yourself, MS Office users should feel right at home. This post was originally created in FreeOffice.)
Figuring that learning how to import APIs/scrape webpage info into FreeOffice spreadsheets might not be so fun (it can be bad enough in Excel), I decided to switch to the web-based Google Sheets for my crypto spreadsheet needs. I figured that Google may have better internet data integration tools. That was only partially true, and subsequently took a large step backwards when the most popular crypto plugin ceased working. But I pushed on and have become moderately competent at getting Google Sheets to work for me.
Level 5+ Excel Grand Wizards will know that with enough time and practise, you can make Excel do just about ANYTHING! It may look similar to its siblings Word and Powerpoint (and the other younger ones that few people use), but under the hood, Excel is a V8-powered, fire-breathing beast! Still used to the formidable capabilities of this beast, I built BrainMetric in Google Sheets.
..and that’s why I’m taking so long to do this.
After much struggling, I realised that it just wasn’t going to work. Using Sheets I simply did not have the tools I needed to effectively process all that data. I don’t blame Google: Sheets is a very capable web app which can do most things, but it just isn’t Excel which can do absolutely anything!
Knowing what I would have to do, I tried the old “ignore the problem and hope it goes away” trick. It didn’t. Eventually I confronted my demons and dusted off some long-neglected bookmarks in my browser. I started the painful process of re-teaching myself computer programming.
Unfortunately programming is not like riding a bike, it’s a perishable skill - one which I learnt at university two decades ago! Modern programming languages evolve constantly: the little which I do remember is horribly out of date. It’s like semi-remembering the home phone numbers of people you knew 20 years ago: you dial a few, half of them are wrong, and the other half no longer work anymore. The language Java is now on version 13. I learnt version 1. An early edition of version 1!
Worse still, I have to fight my way through the badly outdated Java documentation - the hallmark of massive open-source software projects. Since I want to use a specific type of user interface creator (JavaFX), Java 13 is actually not really suitable for my purposes. Java 11 sort of is. Java 8 is. Don’t ask about the in-between version, just don’t. It’s probably only after Java 14 is released in Q2 of 2020 that things will work properly again (after some work by the community). If only I’d know that at the beginning, I would have saved days, days which I wasted trying to correctly configure the programming environment of my PC.
Now that everything is running semi- properly, as much as I want to jump straight into coding BrainMetric, I need to first practise the fundamentals and make stupid mistakes as part of the re-learning process. Yesterday I started writing a very basic word processor program. Once I can get that finished, then I should be about 70% of the way there and will just need to work on charting and data management skills. That and Christmas madness should take me well into early 2020.
So BrainMetric is coming, but I wouldn’t start holding my breath just yet!
For now, what I can tell you is that the prototype charts show a very squashed BTC profile. Something is going to happen soon.
*[1] Stephen Hawking said that when he was writing “A Brief History of Time”, he was advised that each equation in the book would halve his sales. He took the advice to heart and included only “E=mc2”, acknowledging that leaving it out may have doubled the sales of his wildly successful bestseller.
Yours in crypto
Bit Brain

"The secret to success: find out where people are going and get there first"
~ Mark Twain
"Crypto does not require institutional investment to succeed; institutions require crypto investments to remain successful"
~ Bit Brain

Bit Brain recommends:
Crypto Exchanges:


To listen to the audio version of this article click on the play image.

Brought to you by @tts. If you find it useful please consider upvoting this reply.