Trading Using Rectangle Pattern - Crypto Academy / S5W4 - Homework Post for @sachin08
Hello everyone!
There are so many patterns formed by price's actions on the trading chart and understanding how to use these patterns to make trading decisions can greatly increase the chances of making a profit.
This week we explored the formation of rectangular patterns on the trading chart and also how to make trading decisions with these formed rectangles.
This homework post is written in fulfillment of the tasks given in Professor sachin08's lecture post titled " Trading Using Rectangle Patterns".

Task 1:Explain Rectangle Pattern in your own word.
The rectangle pattern is formed when price enters a region where it constantly deflects off a resistance and support lines that are close and parallel. It looks like the 2D drawing of a zig-zag line drawn side-wards entering a rectangular box, deflecting off the longer and parallel sides of the box then exiting.
source : DailyFX
The rectangle pattern refers to a unique pattern that is formed during the pause of an ongoing trend.
Therefore, the criteria for the formation of a rectangle pattern is that the price stops trending temporarily and begins ranging (moving sideways between a parallel support and resistance zone).
The pattern usually represents a period when price solidifies its trending direction before continuing in the direction of the ongoing trend. However, in rare cases, a trend reversal occurs due to already existing macro patterns.
Task 2: How to identify Rectangles. Explain with Screenshots
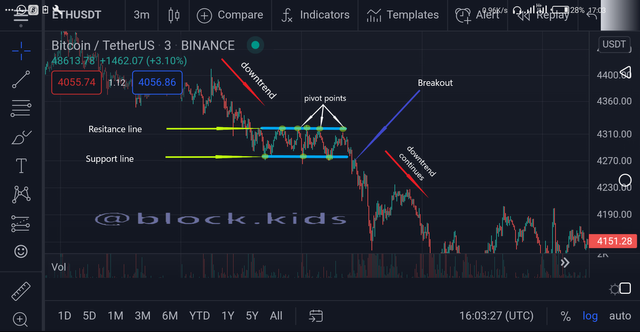
We can identify rectangle patterns on trading charts by being vigilant and observant of the price action and trends. First, watch out for a region where the price stops trending and starts moving in a side-ways pattern (ranging).
Once the price action creates a support and resistance level which are not far apart. Draw two horizontal and parallel trend lines across at least two pivot points of the price at the support level and resistance levels of price respectively as a confirmation of the formed rectangle pattern.
Note: pivot points are singular points where price rejects a support or resistance level by bouncing off the trend line that represents each of these levels after touching either of these Trendlines.
A screenshot of this process is shown below.
 Source :screenshot
Task 3: Can we use indicators with this pattern to get accurate results? Explain with Screenshots.
The answer to this question is definitely, Yes! Using additional indicators will even increase the chances of the trader making a good profit and stem losses.
In the lecture post, professor sachin08 described the behavior volume exhibited before and after the formation of a rectangle pattern. Therefore volume-based indicators can be used to track the formation of rectangle patterns.
Furthermore, I will like to discuss how we can use volatility-based indicators to get an accurate result.
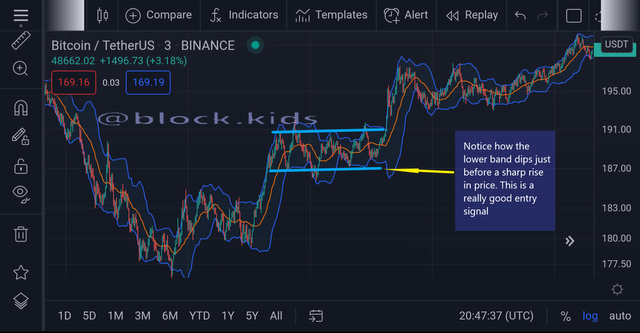
In the screenshot below, you will notice how a volatility-based Indicator like Bollinger bands react, just before the breakout of price.
The lower band dipped and spread out just before the sharp price rise. This kind of information will make a trader enter into a trading position early enough
 Source :screenshot
Task 4: Explain Rectangle Tops and Rectangle Bottoms in your own words with Screenshots of both patterns.
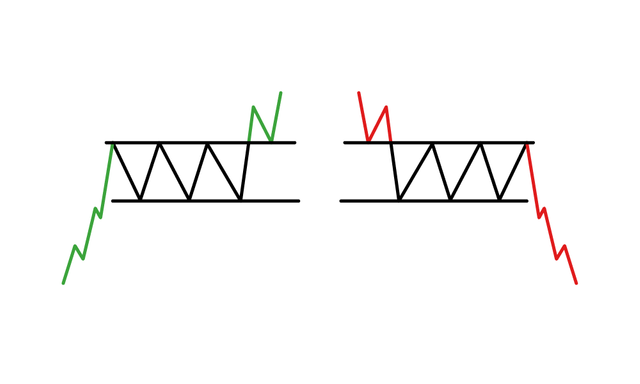
There are two different types of rectangle pattern, namely;
Rectangle tops (Bullish rectangles)
Rectangle bottoms ( Bearish rectangles)
The above rectangles can be distinguished from each other by observing the trend of the price before the formation of the rectangle pattern.
If there was a bearish trend ( price trending downwards ) before price enters the rectangle pattern then, the rectangle pattern formed can be regarded as Rectangle Bottoms. An example of this Rectangle is shown in the screenshot below.
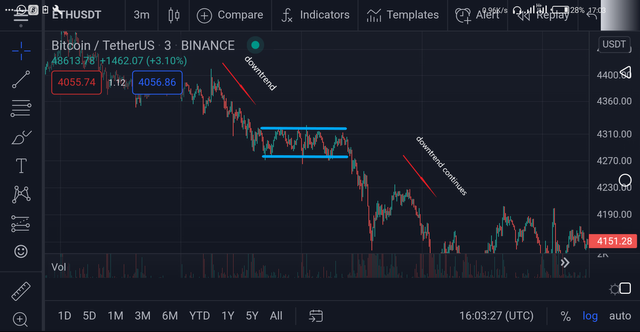 Source :screenshot
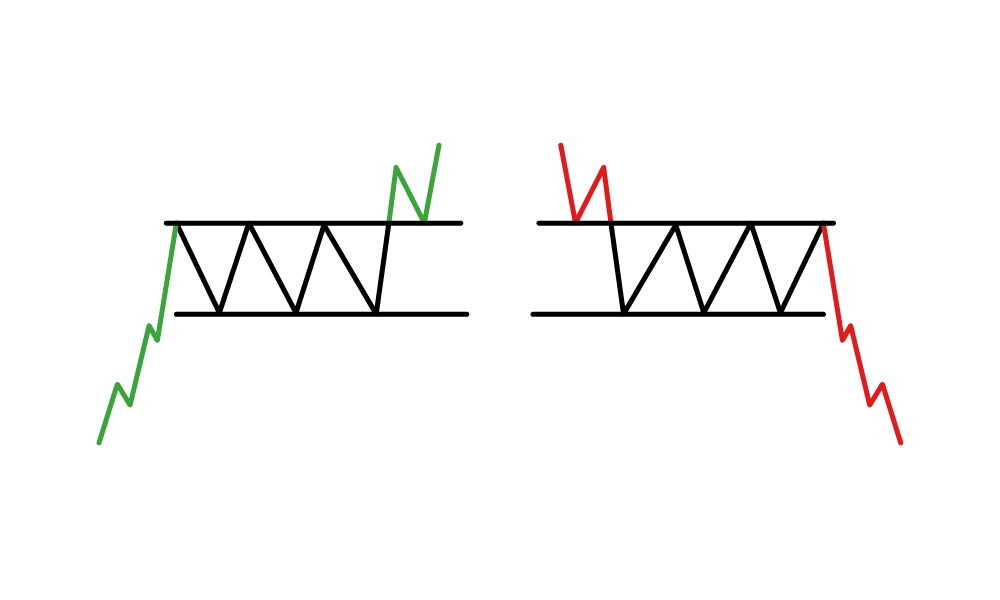
However, If there was a bullish trend ( price trending upwards ) before the price enters the rectangle pattern then, the rectangle pattern formed can be regarded as Rectangle Tops. An example of this Rectangle is shown in the screenshot below.
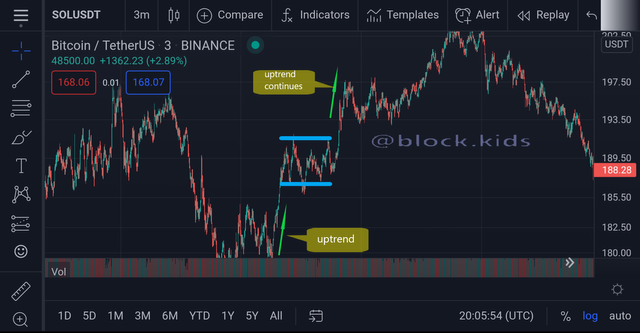 Source :screenshot
Furthermore, there are some price movements traders must be aware of so that they do not get misled when confirming what type of rectangle pattern is about form. These price movements include;
Overshoot
Undershoot
Overshoot: An Overshoot is a short rise in price before the start of any chart pattern.
Undershoot: An Undershoot is a short dip in price before the start of any chart pattern.
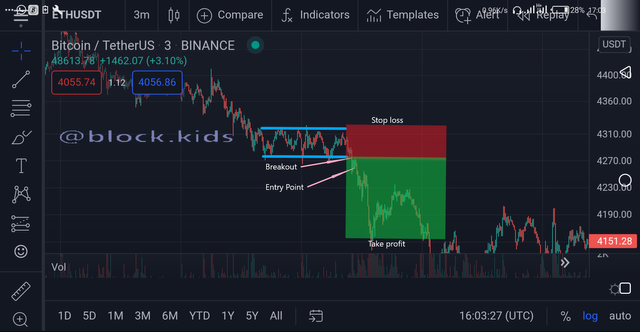
Task 5: Show full trade setup using this pattern for both trends. ( Entry Point, Take Profit, Stop Loss, Breakout)
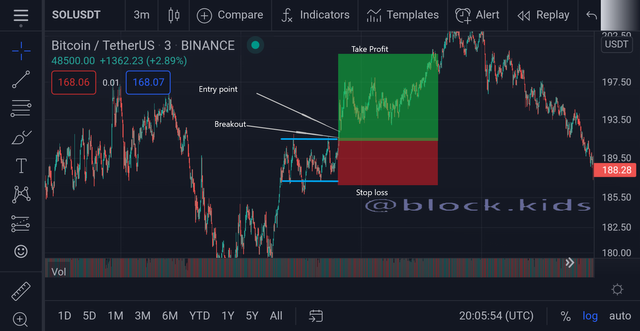
- Buy trade set up
From the screenshot above, the formed rectangle pattern is identified, the breakout point when the price crosses the resistance line is also shown Next, I marked out my entry point, take the profit level above the support line and Stop the loss level just below the Support line.
 Source :screenshot
- Sell trade set up
From the screenshot above, the formed rectangle pattern is identified, the breakout point when the price crosses the support line is also shown Next, I marked out my entry point, take the profit level above the resistance line and Stop the loss level just below the resistance line.
 Source :screenshot
Conclusion
There are several methods that traders use to trade crypto assets in the crypto market and trading using chart patterns is one of the most simple yet profitable methods.
Irrespective of the fact that Rectangle patterns are rare it is still a bonus for traders to make a profit because of how predictable price movements become shortly after exiting the rectangle pattern.
I am very glad to be part of this week's lecture activities. I have undoubtedly become more informed on how to trade using rectangle patterns and I hope to be part of the next lecture.
Thank you for reading!
