Golden Cross and Death Cross Explained
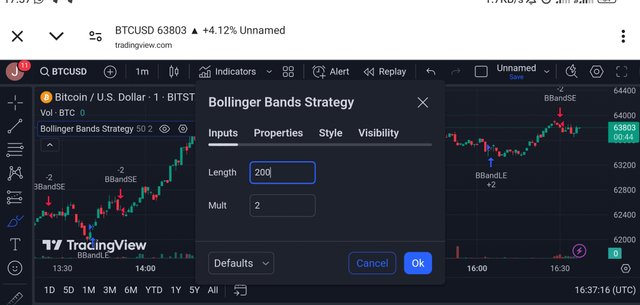
screenshot from my trading view
This topic my sound scary as the case may be but it is an important term majority should know in terms of trading. Chart patterns are abundance when it comes to technical analysis and these patterns and many others are useful to Swing Traders, day traders and investors. The golden Cross and death cross are examples of these chart patterns.
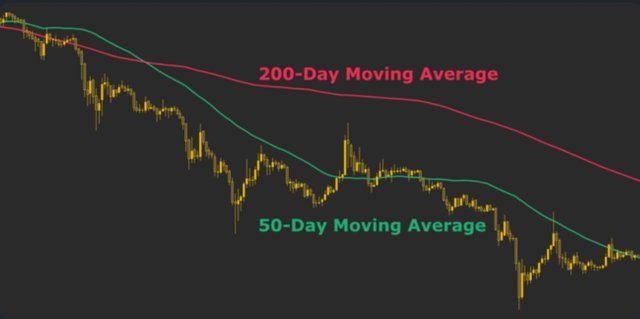
Before we go into these patterns, we must understand an important terminology which is the moving average. It is a line plotted over a price chart that measures the average price of an asset for a given time frame.
These death and golden Cross are used by Traders as a trading strategy. What could these crosses mean?
Golden Cross |
|---|
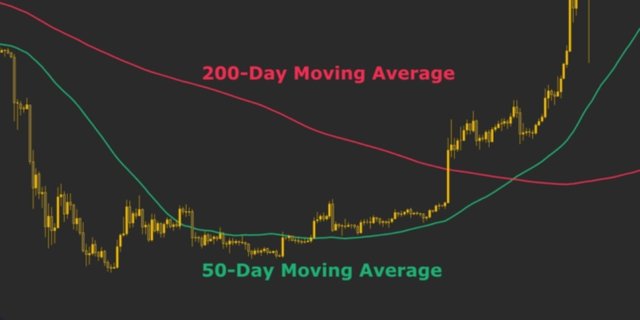
The Golden Cross is a chart pattern involving a moving average that is short-term which crosses above a long-term moving average. For example, the 50 day moving average is used as short-term average which crosses above a long-term moving average and the 200-day moving average is used as a long-term average.
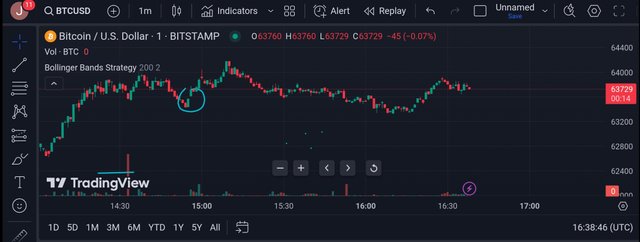
screenshot from my trading view
This golden crossover can happen in any time frame in the moving average and the idea behind this Golden Cross is that it is a short-term average crossing over a long-term average.
A golden cross is seen when the short-term moving average is below the long-term moving average during a downtrend. It is also saying when a trend reverses and the short-term moving average practice above the long-term moving average. And when an uptrend starts where the short-term moving average stays above the long-term moving average, a golden cross is seen.
In most cases, this Golden Cross may be considered a signal that is bullish because the short term moving average isn't below a long-term moving average which makes the long-term price action to the bullish compared to the short-term price action of an asset.
If the short-term moving average is below a long-term moving average, it means that the price action which is short-term is bearish compared to that of the long-term price action of an asset.
Death Crosses |
|---|
Death cross is the opposite of a golden cross and it is chart pattern where a short-term moving average crosses below a long-term moving average. The 50 day moving average crosses below the 200-day moving average. Death cross is typically considered to be a bearish signal. This is seen when the short-term moving average is above the long-term moving average during an uptrend.
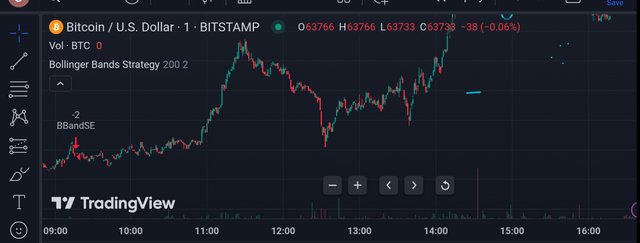
screenshot from my trading view
It is also seen when a downtrend starts when the short-term moving average stays below the long-term moving average. The trend reverses and the short-term moving average crosses below the long-term moving average in a death Cross. As the name implies, this death is likened to the bearish movement of the market where all crypto coins experiences a downtrend or downtime.
The short-term moving average is crossing below a long-term average that is why this bearish signal is demonstrated in this chart pattern. There is also a fault bit cross that can be very much misleading which produces false signals.
As you can see in the screenshot below, this is the false death cross signal that was brought up in 2016 as an example. Beat false date Cross in the market is to resume the uptrend and print a golden cross shortly after the printing of a death Cross in the market.
The difference between these two classes are; while the Golden Cross is considered a bullish signal, the death cross is considered a bearish signal. Both of them can be seen in high trading volumes and both crossovers provide a strong confirmation of a trend reversal that has already happened when they are laughed in these moving averages with no predictive power.
These two chart patterns I reliable tools for confirming long-term reversals in trends in the crypto market as this Golden Cross involves the short-term moving average crossing a both a long-term while the death Cross, crosses below
Two screenshots are from my trading view while the other two are from the reference links dropped here
Disclaimer :Any financial and crypto market information provided in this post was written for informational purposes only and does not constitute 100% investment advice. It's just basic knowledge every crypto trader or investor should have
https://twitter.com/bossj23Mod/status/1781004140354629975?t=HM5X7yx4dK8Pv0LWHLJ2Kg&s=19
Note:- ✅
Regards,
@jueco