ELECTRONIC PARAMAGNETIC RESONANCE (EPR)
Hello friends, today I am going to give you a brief explanation of what is the Electronic Paramagnetic Resonance (EPR).
The Electronic Paramagnetic Resonance (EPR) is a rapid and non-destructive spectroscopic technique, which is based on the Zeeman effect (unpairing of the energy levels of the unpaired electrons, in the presence of a magnetic field), so that in this way, applying a known magnetic field, the unfolding of the energy levels of the unpaired electrons takes place, so that small energy differences are established between said unfolded energy levels.
If an amount of energy is sent that equals one of the energy differences that exist in the split states, a transition of the unpaired electrons between these energy states can be induced, by means of the absorption of energy by said electrons.
For this to happen, an electromagnetic signal with a given energy per hv is sent, in the range of the microwaves (1 to 10 GHz) to the sample as shown below:

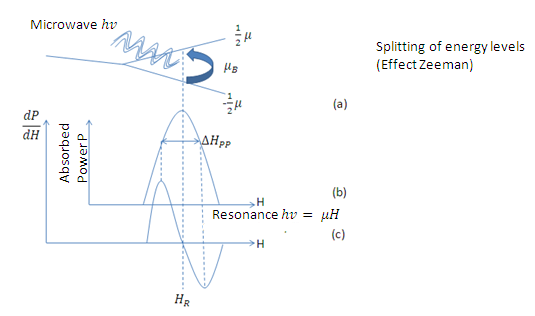
Figure 1. Scheme of the Electronic Paramagnetic Resonance, for an electron with L = 0 and S = 1/2. (a) By applying a certain magnetic field the energy levels are unfolded (Zeeman effect), and sending a microwave signal produces a transition from an energy state -1/2 μ to the state 1/2 μ. (b) Variation of the power absorbed with respect to the applied field. (c) Spectrum obtained by the Electronic Paramagnetic Resonance. The EPR signal appears when absorption occurs. It can be noted that the parameters to be measured in an EPR spectrum are the resonance field
 and the peak-peak line width
The necessary condition to observe a signal by electronic paramagnetic resonance is:

Where g is called the g-factor and for the free electron its value is 2.0023.  is the Bohr Magneton whose value is:
  and
and  is the external magnetic field.
Figure 1 shows a case of an electron with L = 0 and S = 1/2. As we know, the energy levels of the unpaired electrons will unfold in the presence of an external magnetic field (Zeeman effect), however, the energy of the microwave is well defined by hv, so no energy transition will occur, for differences of any energies, but in those that meet the resonance condition given by equation 1, as shown in Figure 1 (a).
Figure 1 (b) shows the variation of the absorbed power with respect to the applied magnetic field. Comparing with the electronic paramagnetic resonance spectrum that would be obtained for this case, (Figure 1c), we can see that the recorded values of the  resonance field and the peak-peak line width
  , in the electronic paramagnetic resonance spectrum, they correspond to the value where the maximum absorption occurs, and to the line width in the middle of the maximum absorption.
We must note that in the spectrum of Electronic Paramagnetic Resonance, what is actually measured is the variation of the imaginary part of the magnetic susceptibility with respect to the applied magnetic field.
Electronic Paramagnetic Resonance is a very useful technique because it allows us to study the material microscopically, since this technique focuses on the interaction of unpaired electrons with their environment.
As is already known, the magnetic behavior of a material varies with temperature, so to characterize the magnetic behavior of a material by any technique, it must work at various temperatures.
The obtaining of spectra by Electronic Paramagnetic Resonance at various temperatures is carried out in order to obtain the variation of the parameters  and
and  with the temperature, which together with the variation of the angle of application of the external magnetic field, give us information about possible phase changes and transition temperatures, defects in the network, anisotropies, among others.
REFERENCES:
Poole, Charles P. Electron Spin Resonance: A compresive treatise on experimental techniques. John Willey & Sons, INC. Ontario (1983)
Silva, P. Estudio de las propiedades magnéticas en semiconductores usando métodos de absorcion de microondas. Tesis doctoral. UCV (2001)
Bersohn, M. Baird, J. C. An introduction to electron paramagnetic resonance. W. A. Benjamin, INC. New York. (1996)
Figure 1 was created by me, using Microsoft PowerPoint

| Guidelines | Project Update |
|---|