On-chain Metrics(Part-3)- Steemit Crypto Academy- S4W5- Homework Post for professor @sapwood
Hello Steemians!
Hope you all are performing well in Steemit Crypto Academy and enjoying the various courses. Here I am submitting my assignment for the lesson about On-chain Metrics (Part-3). I hope my assignment will be up to the required standard.
(1) How do you calculate Relative Unrealized Profit/Loss & SOPR? Examples? How are they different from MVRV Ratio?
Relative Unrealized Profit/Loss (RUPL)
This On-chain matric is calculated by using Market capital and Realised Capital. This indicator is used to predict cycle tops and bottoms. The formula to calculate RUPL is -

Market capital - It is the product of the current price and total no of coins in circulation.
Realized Capital - The product of the no of UTXO and its price. And the sum of all the multiplication is considered as a realized cap.
- Let's assume BTC has 50 UTXO with a circulation of 50 BTC
- 15 UTXOs last moved on price $ 5000
- 20 UTXOs last moved on price $10000
- 15 UTXOs last moved on price $58000
So
Realized capital will be = (15 x5000) + (20 x 10000) + (15 x 60000) = $1105015
Market Capital will be = 50 x 47000 (current price) = $2350000
Relative Unrealized Profit/Loss (RUPL) = (2350000-1105015)/2350000 = 0.529
SOPR (Spent Output Price Ratio)
This matric helps to identify local tops and bottoms. within bull or bearish cycle. It is determined by dividing the sum of the spent value of the UTXO by the sum of the creating value of UTXO.

For a single transaction, it is easy to calculate if one has purchased BTC at $25,000 and sold at $35,000 then SOPR will be 35000/25000 = 1.4
For more than 1 UTXO SOPR will be calculated as follows -
UTXO 1 (2.5 BTC)was purchased at the price of $10000 and UTXO 2 (3.2 BTC) was purchased at the price of $30000. If UTXO 1 was sold at $25000 and UTXO 2 sold at the price of $47000 then,
Sold value = (2.5 x 25000) + (3.2 x 47000) = 212900
Purchase value = (2.5 x10000) + (3.2 x 30000) = 121000
SOPR will be = 212900/121000 = 1.75
Difference between MVRV ratio and RUPL & SOPR
MVRV is the ratio of Market capital to Realized Capital. It indicates either the price is above or below the fair value i.e it helps to predict the bullish or bearish trend.
RUPL It is the ratio of the difference of the value of the market cap and realized cap to the market cap. It helps to identify the tops and bottoms of any bullish or bearish cycle. Actually, it is the ratio of Profit-taking of BTC investors to the market cap.
SOPR It is the ratio of UTXOs selling price to UTXOs buying price and it helps to identify the tops and bottoms within any bullish or bearish cycle.

(2) Consider the on-chain metrics-- Relative Unrealized Profit/Loss & SOPR, from any reliable source(Santiment, Glassnode, LookintoBitcoin, Coinmetrics, etc), and create a fundamental analysis model for any UTXO based crypto, e.g. BTC, LTC [create a model to identify the cycle top & bottom and/or local top & bottom] and determine the price trend/predict the market (or correlate the data with the price trend)w.r.t. the on-chain metrics? Examples/Analysis/Screenshot?
For fundamental analysis here I will use lookintobitcoin.com and BTC as an asset.
Relative Unrealized Profit/Loss
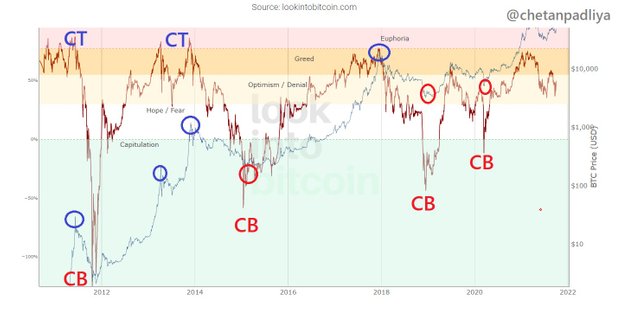
As said earlier this On-chain metric is helpful to identify the top and bottom fo the bull/bearish cycle, in the chart, we can see that clearly.
In the above chart, it is divided into different zones. Above 0 and below 0. If RUPL is above 0.75 (or 75%) it is considered a euphoric zone. When market capital increases much faster than the profit-taking and the price comes in the euphoric zone it makes the top of the cycle. This is a red zone and the risk is very high to invest in this euphoric zone. Most likely the price take reversal from here.
According to the above chart In the history of Bitcoin, the price went 4 times (2 tops and 1 double top) in the euphoric zone and took reversal from there within a short period of time.
When the price goes below 0 it is considered as a bottom zone or accumulation phase. 0 and 0.75 are extreme values between that either bullish or bearish cycle.
The zone between 0 to 0.75 is also categorised into capitulation, hope/fear and greed
Interpretation of RUPL on BTC chart
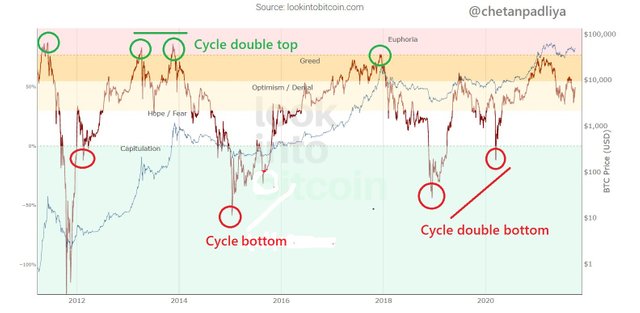
Analysis of RUPL on BTC chart from 2012 onwards Source
On several occasions, it is observed that BTC made historically top and if we add RUPL on the chart it is clear that every time RUPL crosses 0.75 line and enter the euphoric zone a historical top is observed.
From the birth of BTC it is observed that it made its first 2 digit top on June 11 and at that time RUPL was at 0.82. After that, a bear cycle started and made a low of about $4 with RUPL -0.12.
After that again a bull cycle started and BTC made the historically cycle double top from between April to Nov 2013. At the time of top RUPL was 0.83
In the next bear cycle a bottom was formed at about $201 in Jan 2015 and RUPL was below 0 at -0.55
The next bull run was about 2 years long and again touched a historic high at about $19325 with RUPL in the euphoric zone at 0.78
Like a big bull run the next bear phase was also about 3 years long and RUPL comes 2 times below 0 to make double bottom at 3236 and 5232 with RUPL at -0.44 and -0.12 respectively, it was a good accumulation zone for long term investors.
After that BTC is in a continuous uptrend making local top and bottom but still haven't entered in euphoric phase to make new historically top.
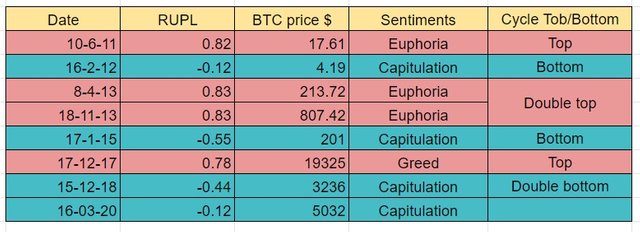
From the data tabulated above it is clearly observed that RUPL is very helpful to identify the cycle top and bottom of any bull or bear phase of any asset including BTC which has UTXO data available.
Interpretation of SOPR on BTC chart
Unlike RUPL this matric is helpful to identify the tops and bottom in any bull or bear phase so, known as local top and bottom. After bottom in Dec 2018 a euphoric phase is yet to come so for this analysis here I choose the time period of Dec 2018 onwards. Although there was an accumulation phase with a cycle bottom at about $5000, the trend is still bullish.
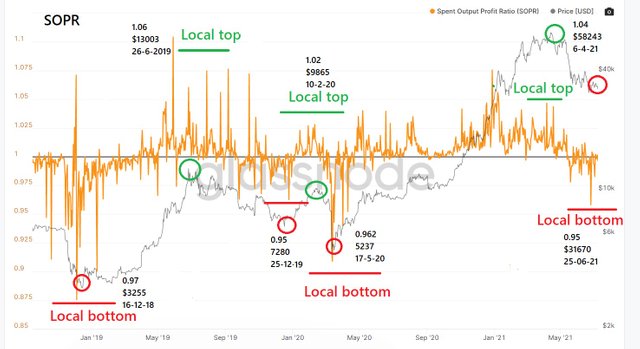
Analysis of SOPR on ongoing bull cycle on BTC chart from Dec 2018 onwards Source
In the bullish cycle, there was several local tops and bottoms marked in the chart above.
SOPR is measured by above 1 and below 1. If it moves significantly above 1 a local top is formed and if it moves below 1 local bottom is observed on the chart.
For traders, can use this matric in the combination with other indicators to identify the but and sale signals. When it reaches around 1 in the bull cycle it is a buy signal and similarly, if it reaches 1 in the bear cycle it is considered as a sale signal. It is not useful for day traders or small-term trade
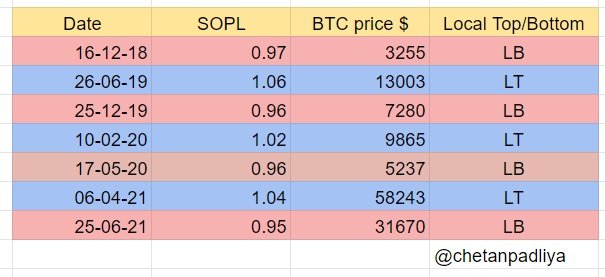
From the chart and data tabulated above it is clearly observed that how the price makes local top and bottom whenever SOPL goes significantly above and below 1. Historically varies between 1.1 and 0.9 and makes tops and bottom.
There could be some cycle bottom or top in the ongoing trend like there was a cycle bottom of about 5000 but here it is identified as a local bottom as this matric is not for to identify the cycle tops and bottom.

(3) Write down the specific use of Relative Unrealized Profit/Loss(RUPL), SOPR, and MVRV in the context of identifying top & bottom?
Different metrics are used to identify the different indications in the different time frames/cycles. Here we will discuss the use cases of three different matrics viz RUPL, SOPR and MVRV
Relative Unrealized Profit/Loss(RUPL) use cases
In the historic chart of any UTXO based asset like BTC, LTC it is a useful metric to identify the historic top in the bull run and consequent bottoms after that bull run. A value above 0.75 is a euphoric zone high of that zone is considered as a cycle top.
As discussed in the above task RUPL above has different zones above like Hope/Fear(0-0.30), Optimism(0.30-0.55), Greed(0.55-0.75) and Euphoria( above 0.75) So this matric is helpful to measure the sentiments of the market.
The value below 0 is considered as capitulation/ accumulation zone and a cycle bottom is formed in this zone.
Spent Output Price Ratio (SOPR) use cases
It is also used to identify the tops and bottom but unlike RUPL it is used to identify the tops and bottom within any bull or bear cycle. Its value ranges below and above 0 levels. Historically it moves between the value of 0.09 and 1.1.
A value approaching near to 1 in the bull cycle can be used as a buy signal while a value approaching 1 in the bear cycle can be used as a sale signal. The midterm to long term trader can use it to confirm the buy/sell signal by using it in combination with other technical indicators.
MVRV use cases
MVRV matric is the ratio of market cap to realized cap that gives the sense of fair/unfair value. If MVRV >100 and moving up with higher tops and higher bottom it is considered the market in a bullish trend and if the MVRV ratio becomes too high it indicates the market is overvalued and a reversal can happen.
Similarly on the downside when MVRV<100, if the price making lower high and lower lows it is the indication of the bearish trend and if MVRV goes too low it is considered the market if undervalued and a reversal is possible.
With the above two observations of MVRV, it can be used to determine the top and bottom of the market with the help of other indicators. As soon as the MVRV ratio falls below 100% in the bull market, a support zone can be identified with the help of other technicals and fundamental indicators and a buy entry position can be initiated.
Using MVRV with RUPL, to find out the historical top is an excellent combination of On-chain matrics in long term analysis.

Conclusion
Both the On-chain matrics discussed above are used to determine the top and bottom of the market but in different scenarios. RUPL helps to determine the historical tops consequent bottom after that, of the UTXO based assets. This matric is only for long term analysis of the price and anticipation of coming trends.
SOPL on the other hand also used to determine tops and bottom but within a trend either bullish or bearish. Using it to find out cycle tops and bottom is not recommended.
MVRV is another matric discussed in the previous lesson but here when it is combined with RUPL gives a better indication of the historical top.
Thank you Prof. @sapwood for such an insightful and interesting lecture once again.


