SPS Price Broke up Falling Wedge Pattern Finally!
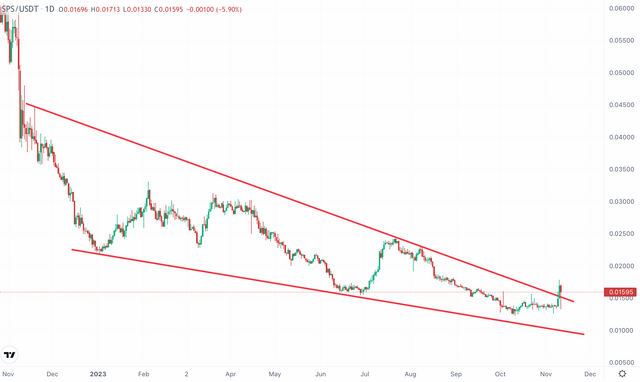
SPS price broke up falling wedge pattern finally. I shared lots of price analysis for SPS and showed this pattern on chart.
After Bitcoin and altcoins pump, SPS finally followed them and went up 20% from 0.013 USD and broke up this resistance..
Here you can see daily chart of SPS and there is falling wedge pattern coming from end of 2022. SPS price is in this pattern for a year..

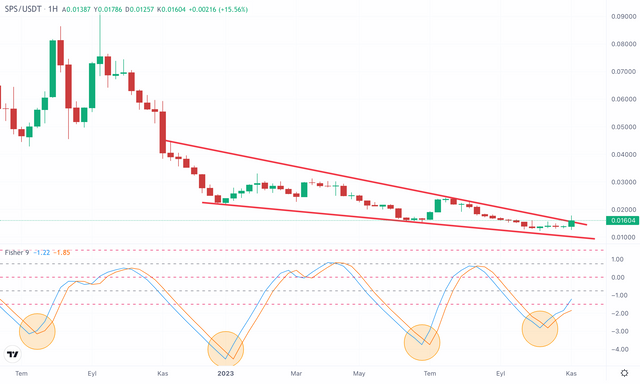
When we look at weekly chart of SPS, It showed us reversing.. I shared you this chart. Fisher Indicator in weekly chart show us the trend. I circled the bottom of Fisher Indicator and they reversing. You can see what happened after reversing.

We are not still in bullish season. It may be exit pump..
We will see...
Thank you, friend!


I'm @steem.history, who is steem witness.
Thank you for witnessvoting for me.
please click it!
(Go to https://steemit.com/~witnesses and type fbslo at the bottom of the page)
The weight is reduced because of the lack of Voting Power. If you vote for me as a witness, you can get my little vote.