Technical Indicators - Crypto Academy / S4W2- Homework Post for @reminiscence01 by @culzee
My dear fellow Steemians, I am very happy to be part of this lecture by Prof. @reminiscence01. The teaching is explicit. I have desired to learn Technical Indicators for a long time because of it's importance. I really spent quality time to study this topic because I wanted to properly understanding it. I read this lecture over and over before writing this home work. Here is my home work post.

HOME WORK QUESTIONS
a) In your own words, explain Technical indicators and why it is a good technical analysis tool.
b) Are technical indicators good for cryptocurrency analysis? Explain your answer.
c) Illustrate how to add indicators on the chart and also how to configure them. (Screenshot needed).
a) Explain the different categories of Technical indicators and give an example of each category. Also, show the indicators used as an example on your chart. (Screenshot needed).
b) Briefly explain the reason why indicators are not advisable to be used as a standalone tool for technical analysis.
c) Explain how an investor can increase the success rate of a technical indicator signal.
QUESTION 1a
In your own words, explain Technical indicators
Technical indicators:
In my own words, Technical indicators refer to a heuristic technique or mathematical calculations by which historical market data is analyzed and presented in a graphic form to judge the entry and exit points for trades in order to help forecast the direction of new market prices and general market trend of assets. Technical indicators deal mostly on assets trading data history such as price, volume, and open interest. In a simple sentence, Technical indicator can be seen as a graphic representation of price action.
Active traders use Technical Indicators to study and analyze the previous closing and opening prices of an asset to predict its future price movements. Technical Indicators help to spot the reaction of traders in the past over forces of demands and supply and this observation is used for reference in their future analysis.
Although technical indicators can be used as a good cryptocurrency trading strategy, but they should not be used alone to completely make trading decision. They should be used together with other technical analysis tools for signal confirmation.
Some examples of technical indicators we have are:
- Relative Strength Index (RSI)
- Moving Average Convergence Divergence (MACD)
- Stochastics
- Bollinger Bands.

Why it is a good technical analysis tool.
Technical indicators is a very good technical analysis tool because of the following reasons:
- They help us to understand the condition of the market at a particular point in time
- They help us to understand the momentum of market trends, so that we can make a good trading decision
- They give us confirmation signal on when to buy or sell
- They help us to understand the market reactions which will enable us avoid risks
- They help us to predict prices direction of assets in the future

QUESTION 1b
Are technical indicators good for cryptocurrency analysis? Explain your answer.
Technical indicators are very good technical analysis tool for cryptocurrency analysis. The reason is because they help us:
- to understand the market condition of cryptocurrency over a period of time
- to predict the direction of cryptocurrency prices in the future
- to confirm signal on when to buy or sell our crypto, especially when used with other technical analysis tools.
- to understand and determine the momentum of cryptocurrency prices in the market
QUESTION 1c
Illustrate how to add indicators on the chart and also how to configure them. (Screenshot needed).
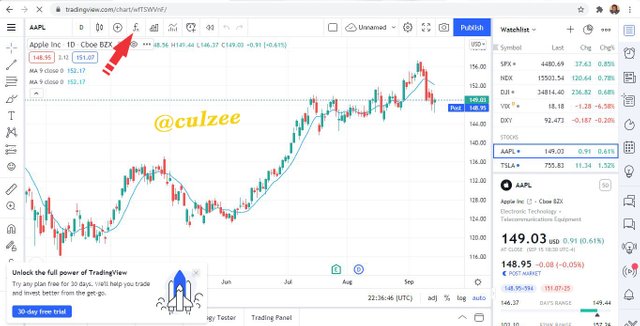
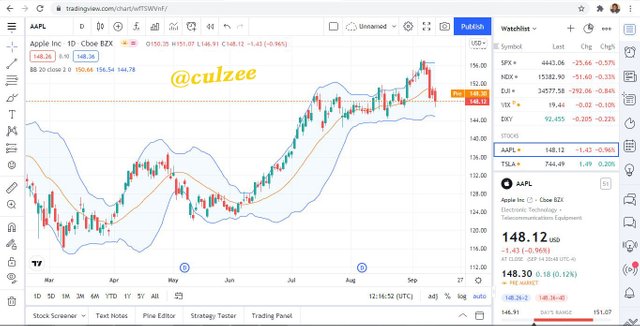
To add indicators on my chart, these are the steps I followed:
Step 1: I Logged on to trading view website

Step 2: I clicked on chart

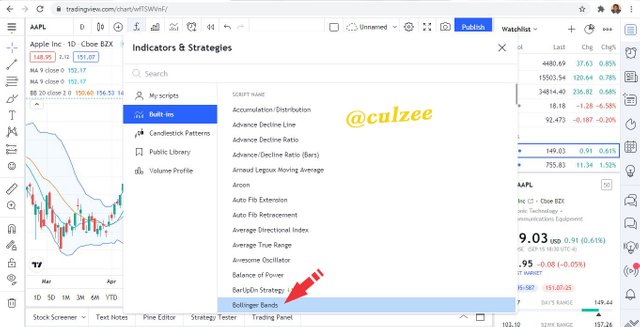
Step 3: I then clicked on "fx" indicator icon on the menu bar to add indicator of my choice
A list of indicators appeared, and I clicked on Bolinger Band and the indicator was added to the chart.
Step 4: I closed the Indicator and Strategies pop-up.
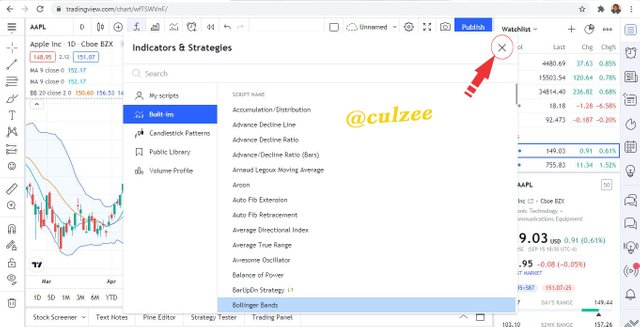
Then I could see the Bolinger Band indicator clearly added to the chart.
How to configured technical indicators
Step 1: Right click on the indicator
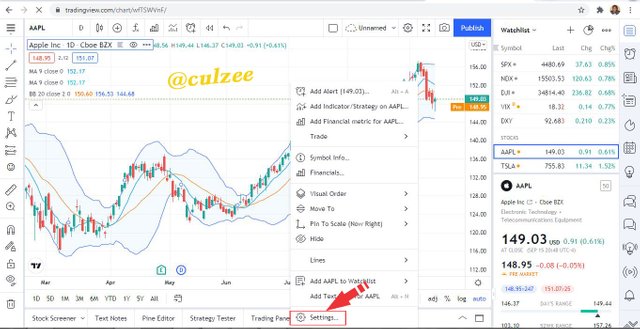
Step 2: Click setting and your chart Settings will show up (you will see different features like: Symbol, Status Line, Scales, Appearance, Trading and Events). You can click on them and configure your indicators as will best suit you.
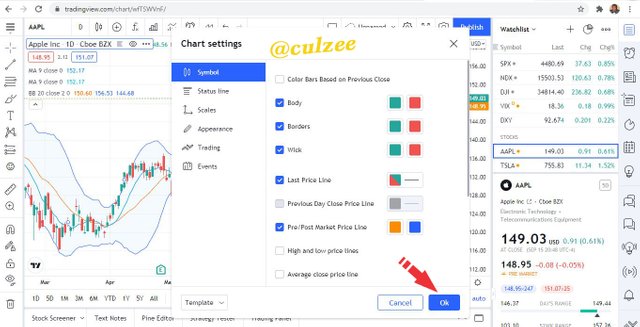
Step 3: Then click OK
QUESTION 2a
Explain the different categories of Technical indicators and give an example of each category. Also, show the indicators used as an example on your chart. (Screenshot needed).
There are different categories of technical indicators traders can use for their trading and investment. Technical Indicators can be divided into the following different categories: Trend Indicators, Mean Reversion Indicators, Volume Indicators, and Momentum Indicators. Good understanding and proper use of them will surely lead traders to high profit in their investments. Let me discuss each of the categories with one example each.
1. Trend Indicators:
This type of Technical Indicators helps traders to measure the direction of the market trend. Trend Indicators analyze the direction of market is movement. They indicate if a market is moving up, or whether the market is going down, or sideways over a period of time. Trend Indicators differentiate up and down market trend from that of ranging markets.
Some examples of Technical Indicators are:
i. Moving Average Convergence Divergence (MACD)
ii. Parabolic SAR
iii. Ichimoku Kinko Hyo
iv. Average Directional Index ( ADX)
This is a screenshot of Moving Average Convergence Divergence (MACD)
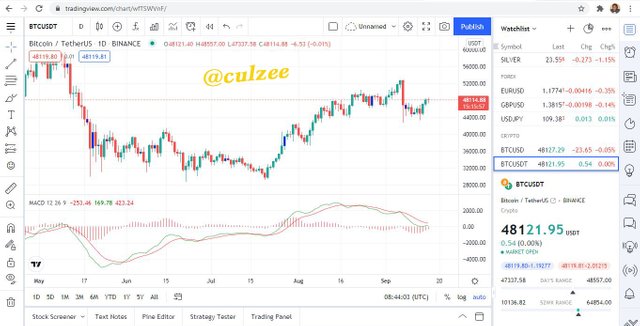
2. Mean Reversion Indicators:
This is the type of Technical Indicators that measure how far market price can go or stretch before it will return back to the average. Traders who use this Technical Indicators believe that when price of assets go up, that it will reach to a point where it will still reverse back to it's average levels.
It is important to note that when price rises and moves away from mean level that it does not really mean that the price will fall. When the mean moves up to meet the price and the price returns back in line with its average, it would also constitute reversion to the mean.
Some examples of Technical indicators that can be used to notify traders when the price of assets reach to a point where it may reverse back to it's average levels include:
i. Bollinger Bands
ii. Regression channels
iii. Keltner channels
iv. Envelopes
Below is a screenshot of Bollinger Bands on my chart
It is also important to note that these indicators can not give traders a clear indication of price reversal but they can only provide market signals.
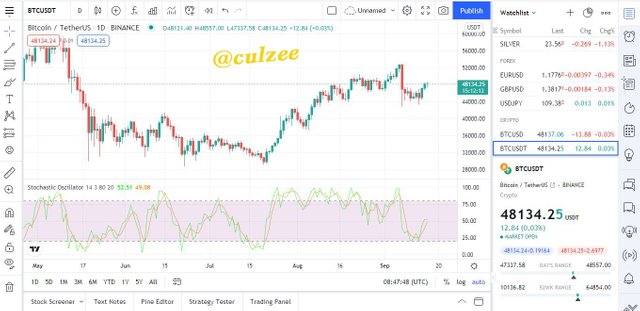
3. Volume Indicators:
This is the type of technical indicators that deal with the strength or movement of assets price in a market trend based on volume.
Some examples of Volume indicators are:
- Accumulation / Distribution indicator, * Money flow index, * On-Balance indicator, * Volume RSI, * Stochastic Oscillator, * Negative Volume Index, * VWAP, * VWMA, * Chaikin Money Flow, * Volume Profile
This is a screenshot of Stochastic Oscillator on my chart
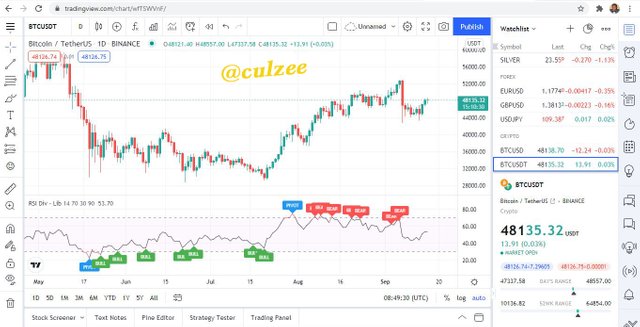
4. Momentum Indicators
This is the type of technical indicators that is used to analyze the speed at which the price of assets change over a period of time. They measure the rate at which the price of assets rise or fall. Momentum Indicators are called Oscillators because they indicate when the price of assets are overbought or oversold.
Some of the examples of momentum indicators are:
- Stochastic
- Relative Strength Index (RSI).
- Moving Average Convergence Divergence (MACD)
Below is a screenshot of Relative Strength Index (RSI on my chart
QUESTION 2b
Briefly explain the reason why indicators are not advisable to be used as a standalone tool for technical analysis.
The major reason why indicators are not advisable to be used as a standalone tool for technical analysis is because they can not give traders an accurate and perfect price indication. It is better and safer to use them together with other technical analysis tools as a support and signal confirmation indicators. This will help traders to dictate false signals and to avoid some careless mistakes and loses in trading.
QUESTION 2c
Explain how an investor can increase the success rate of a technical indicator signal.
An investor can increase the success rate of a technical indicator signal by
- Ensuring that the trader or investor selects the best indicators that he or she can use very well and that is suitable to his or her trading style.
- Ensuring that the trader combines two or more technical indicators in order to confirm a signal on price movement before engaging in trade.
- Ensuring that the trader is always available and ready to take action when the signal is confirmed.
Conclusion
It has been an interesting class. The importance of the knowledge and right application of Technical Indicators can not be over-emphasized. Adhering to the advise of using technical indicator together with other technical analysis tools as a support and signal confirmation indicators will help traders to dictate false signals and to avoid some careless mistakes and loses in trading.
Thanks to our lecturer, @reminiscence01 for the lecture. God bless you.
Hello @culzee , I’m glad you participated in the 2nd week Season 4 of the Beginner’s class at the Steemit Crypto Academy. Your grades in this task are as follows:
Recommendation / Feedback:
From your explanation, i believe you have clearly understood technical indicators and why it is an important technical analysis tool.
Thank you for participating in this homework task.