Steemit Crypto Academy | Season 5: Week: 6 | Homework post of @reddileep || Highly Profitable Trading Strategy with VuManChu Cipher B Indicator by @dabeerahmed
Yesterday I go through the lecture taught by our respected professor @reddileep which is all about highly profitable trading with VuManChu Cipher B Indicator indicator and here is my homework post in this regard, so let's begin with it without wasting much time;


1. Define VuManChu Cipher B Indicator in your own words.

VuManChu Cipher B Indicator
The VuManChu Cipher B is a technical indicator used in the technical analysis of cryptocurrency assets. It is made up of various indicators that have been fused together to form a highly profitable trading technique. The VuManChu Cipher B includes indicators like as the relative strength index (RSI), market volume and momentum, money flow, and so on. The VuManChu Cipher B indicator was created by modifying the market cypher B indicator. The indicator can be accessed via a public library script developed by VuManChu, and it is also free to use on the Tradingview platform.
Traders use VuManChu Cipher B to detect the current trend using wave trends, areas of volume flow (inflow and outflow) using the money flow index. This combination makes it easier for traders to detect profitable trading signals. Though the indicator is considered advanced due to its numerous oscillating lines, it is extremely understandable and simple to use.
The VuManChu Cipher B indicator represents the cumulative volume flow (inflow and outflow) with two lines that oscillate within the asset's wave trend. The wave trend has a dot system (i.e. red and green) signal that is formed after a crossing indicating which side of the market has price control, where the green represents the buying and the red represents the selling.
Following the ideas outlined above, the VuManChu Cipher B indicator can confirm price direction with evolving price action. This corresponds to the demand and supply concepts, where buying pressure creates demand, which causes the asset's price to rise, and selling pressure creates surplus supply, which forces the asset's price to fall.

2. How to customize the VuManChu Cipher B Indicator according to our requirements? (Screenshots required)

Adding VuManChu Cipher B Indicator
Now I'll demonstrate you how to include the VuManChu Chiper B Indicator into a cryptocurrency chart. TradingView is the platform I'm using to illustrate this example.
- To access the chart interface, go to Tradingview.com's official page and click on Chart.
- On the chart interface, click the Fx indicator button in the upper centre of the chart page.
- The page for the indicator library emerges. To quickly find our recommended indicator, enter VuManchu Cipher B into the search box.
- Once the indicator list has been sorted, click on VuManchu Cipher B + Divergences to add it to the chart. This is demonstrated further in the screenshots which are provided below.
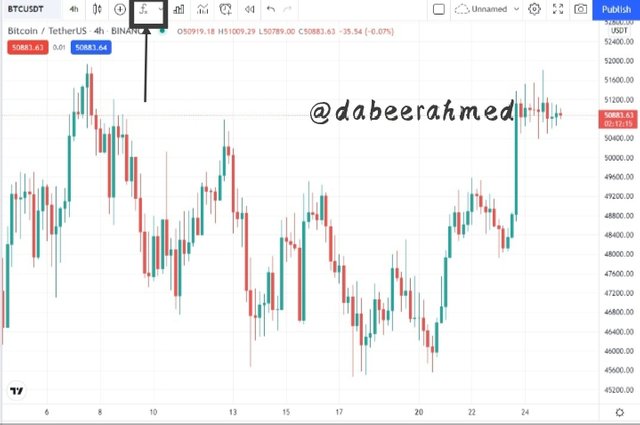
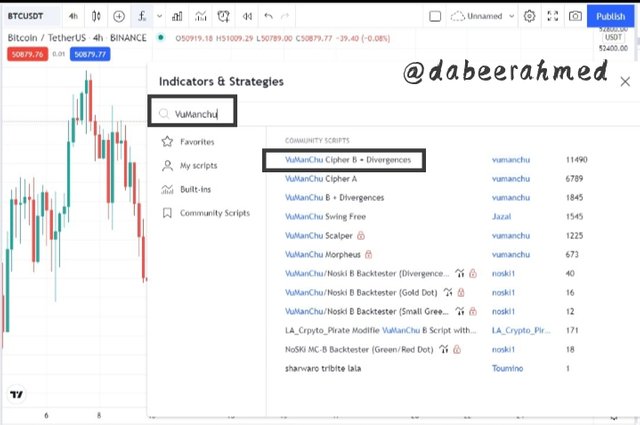
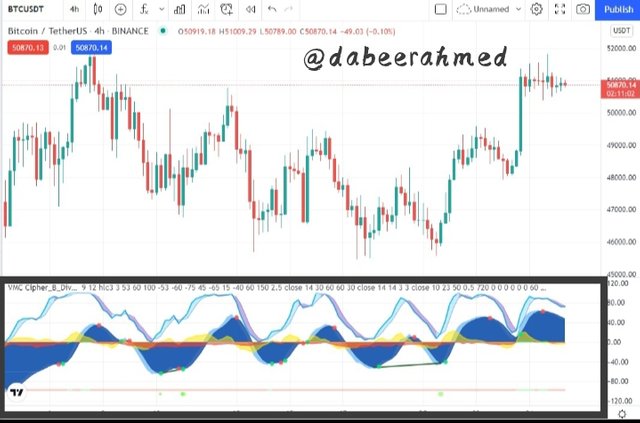
Customizing VuManChu Cipher B Indicator
In this section, we will modify the VuManchu Cipher B indicator to our trading approach for this study. The following are the examples by the hepl of which we can customise the indicator;.
- Click the settings icon in the top left corner of the indicator window on the recently added indicator. The indicator parameters popup in which we will removing the indicators that are not required for this trading technique.
- We will untick the following indicators on the input interface because they are not necessary for our trading method. WT Regular Divergences, 2nd WT Regular Divergences, and Stochastic RSI are among them. We can get rid of them by unchecking the box displayed in the screenshot below.
- After we've customised the inputs and removed all the extraneous indicators. Now we'll use the style interface to change the appearance of the indicator on the chart. This is accomplished by selecting style.
- In this section, we will be removing the VWAP (volume-weighted average pricing indicator). This indicator has been determined to be unimportant to our trading approach.
- The "MFI Bar Color" indicator is another that should be eliminated. This is the money flow index colours bar, which is displayed below the indicator window. Then, click Ok to save your adjusted settings. This is demonstrated further in the screenshots which are provided below.
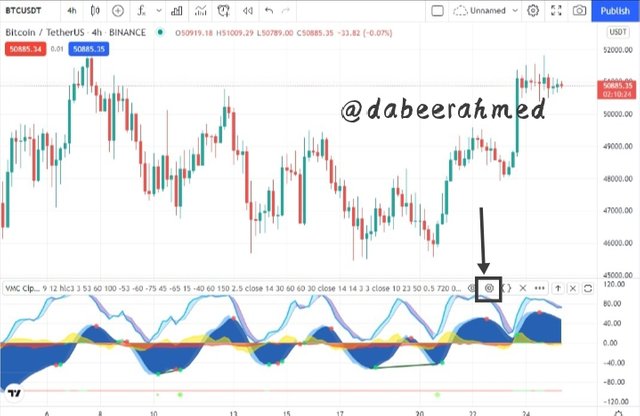
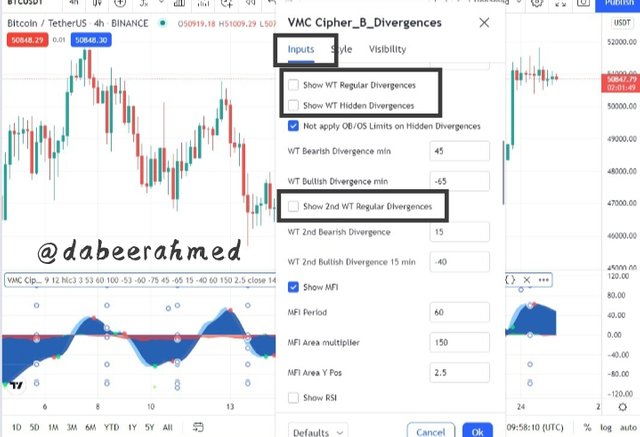
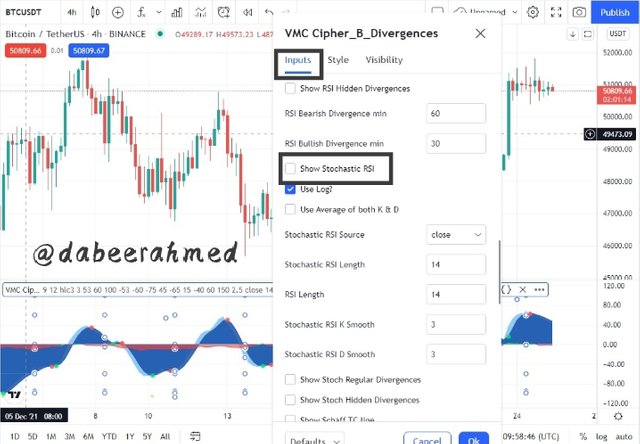
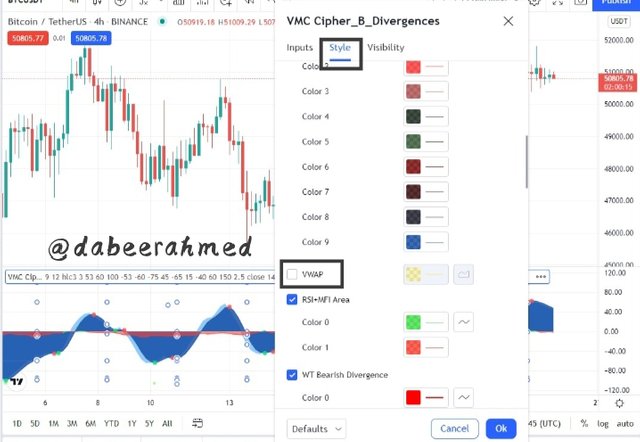
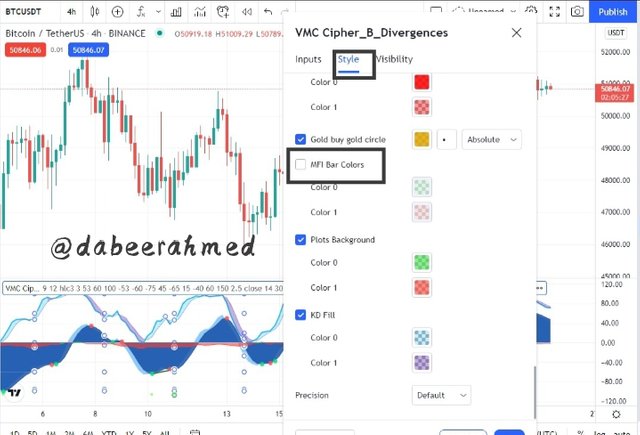


3. Explain the appearance of the VuManChu Cipher B Indicator through screenshots. (You should Highlight each important part of this indicator by explaining their purpose)

VuManChu Cipher B indicator Appearance
As previously stated, the VuManChu Cipher B indicator is made up of numerous indicators that are fused together to form the trading system. To properly grasp the indicator, one must first comprehend the numerous components that comprise it. I'll go over the various components of the indicator below:
Wave Trend Indicator
The wave trend indicator is represented by the blue filled line that oscillates within the indicator bound, forming the indicator's base. The wave trend is made up of two-tone blue lines, the light blue line and the dark blue line.

As can be seen, the blue line crossing is marked with dots (either red or green), showing which side of the market controls the price.

Money Flow Index Indicator
The money flow index is the cloud-like filled line within the wave trend that represents the flow of capital into and out of the traded asset. It is illustrated by two colours (either red or green), with the green colour indicating capital inflow and the red colour indicating capital outflow.


4. Demonstrate your preparation for the Trading Strategy by combining other indicators. (Instead of showing the addition of indicators to the chart, you should explain the purpose of each indicator for this trading strategy.)

VuManChu Cipher B indicator And EMA
Technical indicators are not intended to be used as stand-alone trading techniques because they are prone to producing false signals and failing to detect market fakeouts. As a result, indicators are intended to be used in conjunction with other technical analysis tools or indicators in order to generate a true signal.
2 Exponential moving average is paired with VuManchu Cipher B in the trading technique discussed in the lesson to make better trading decisions and to corroborate the trading signals from the indicator.
This is accomplished by combining 55 EMA with 200 EMA. The crossing of the two EMAs is a strong trading signal that indicates a change from a bullish to a bearish trend. When the 55 EMA crosses over the 200 EMA, it implies a bullish movement and market control by buyers over sellers. And when the 55 EMA crosses below the 200 EMA, it suggests a negative trend and a market domination of selling over buyers.
The crossing of the two EMAs, paired with the signal from the VuManchu Cipher B indicator, provides traders with a strong trading signal. Before entering any trade positions, the signal is confirmed on the VuManchu Cipher B indicator once the EMA has crossed. This can help to ensure a safe trading experience while also filtering out misleading signals. The chart below shows an example of the combination.
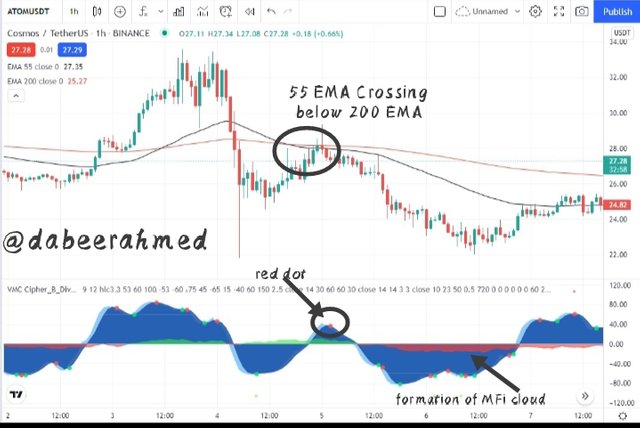
The EMA crossover intersects with the VuManchu Cipher B indicator on the ATOMUSDT chart above. The crossover of the 55 EMA below the 200 EMA indicates a bearish move, which the VuManchu Cipher B indicator confirms. We can observe a red dot appear on the indicator during the crossing of the light blue wave below the dark blue wave. Similarly, we can notice the formation of the red cloud, which signifies a money outflow in the ATOMUSDT price. When all of this is considered together, it verifies the sell setup.

5.Graphically explain how to use VuManChu Cipher B Indicator for Successful Trading. (Screenshots required)

Trading Using VuManChu Cipher B indicator
As previously stated, using the EMA and the VuManChu Cipher B indicator requires the two different indicators to confirm the price's directional bias before ensuring the trade signal is accurate. I'll show you an example below:
Buy Trade Using VuManChu Cipher B indicator
The 55 EMA must cross above the 200 EMA in a bullish scenario to confirm the EMA bullish trade signal. The VuManChu Cipher B indicator must confirm the trade signal once the requirement is met.
The volume flow (MFI) on the VuManChu Cipher B indicator must be green, indicating an inflow of money to the asset. This follows the concepts of demand and supply, as inflow increases demand, which forces the asset's price to trade upwards.
Finally, on the VuManChu Cipher B indicator's trend wave, the crossover of the dark blue line and the light blue line should be marked with a green dot, indicating that the current trend is bullish. This means that buyers have power over the price for the chosen time period. Examine the chart below;
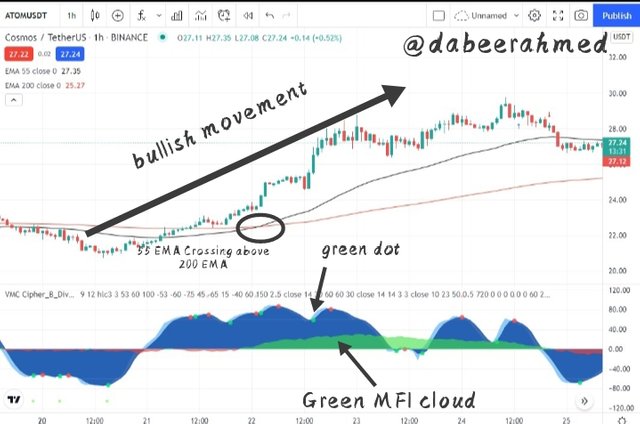
The EMA and the VuManChu Cipher B indicator, as seen, both verified the bullish trend, satisfying every required criteria. As can be seen, the money flow index was green, the wave trend crossover was green, and the EMA crossed. This was followed by a bullish price movement.
Sell Trade Using VuManChu Cipher B indicator
The 200 EMA must cross above the 55 EMA in a bearish scenario to confirm the EMA bearish trade signal. The VuManChu Cipher B indicator must confirm the trade signal once the requirement is met.
The volume flow (MFI) on the VuManChu Cipher B indicator must be red, indicating an outflow of money from the asset. This follows the concepts of demand and supply, as outflow creates supply, which forces the asset's price to trade downward.
Finally, on the VuManChu Cipher B indicator's trend wave, the crossover of the dark blue line and the light blue line should be marked with a red dot, indicating that the current trend is bearish. This signifies that sellers have pricing control for the selected time period.
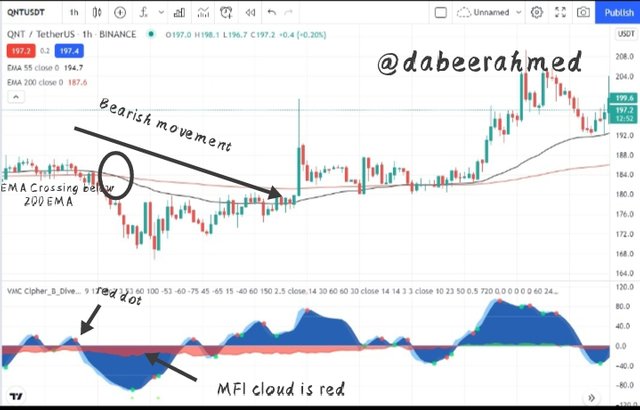
As seen, the EMA and the VuManChu Cipher B indicator both verified the bearish trend by fulfilling all of the necessary conditions. As can be seen, the money flow index was red, the wave trend crossover was also red, and the EMA crossed. This was followed by a downward price movement.

6.Using the knowledge gained from previous lessons, do a better Technical Analysis combining this trading Strategy and make a real buy or sell order in a verified exchange. (You should demonstrate all the relevant details including entry point, exit point, resistance lines, support lines or any other trading pattern)

Buy Trade BAKEUSDT (1 hour)
Now I'll demonstrate you how to use the VuManChu Cipher B Indicator to make a genuine trade. As we all know, the VuManChu Cipher B Indicator is a rare indicator that can only be found on a few chart provider platforms. Thus far, I've only been able to get this indicator on TradingView, so before I trade on a cryptocurrency, I'll first analyse it in TradingView.
In the first stage, I opened TradingView and added the VuManChu Cipher B Indicator and the 2 line EMA Indicator to a cryptocurrency chart. After I finished changing the default settings, I started searching for crypto charts that met the trading requirements. Because I will be trading in the short term, I use a timeframe of one hour. After so much consideration, I decided to trade in the BAKE/USDT coin.
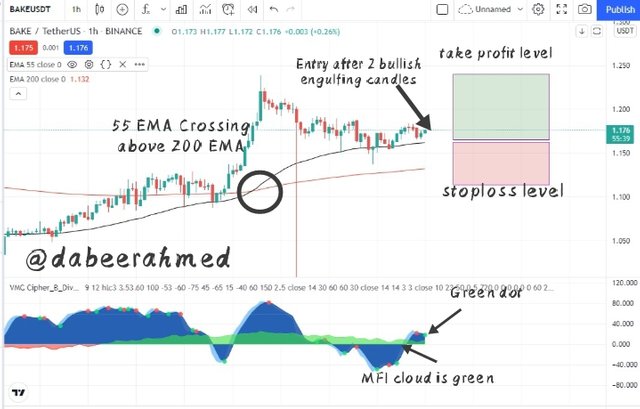
The first signal is provided by the EMA indicator, which shows a "Golden Cross" moment when both EMA lines cross. The Trend Wave Cloud also indicates that money is entering the BAKE/USDT market.
After a while, there is a "Green Dot" that indicates a trend change in the Wave Cloud and verifies the Bullish Trend indicator provided by the EMA Indicator. In this case, I decided to place a trade with an Entry Point of $1.164 and a Stop Loss Level slightly below the EMA200 Line, which functions as a Dynamic Support Line; the Stop Loss price I set was $1.12. Finally, I utilize the Risk/Reward Ratio of 1:1.
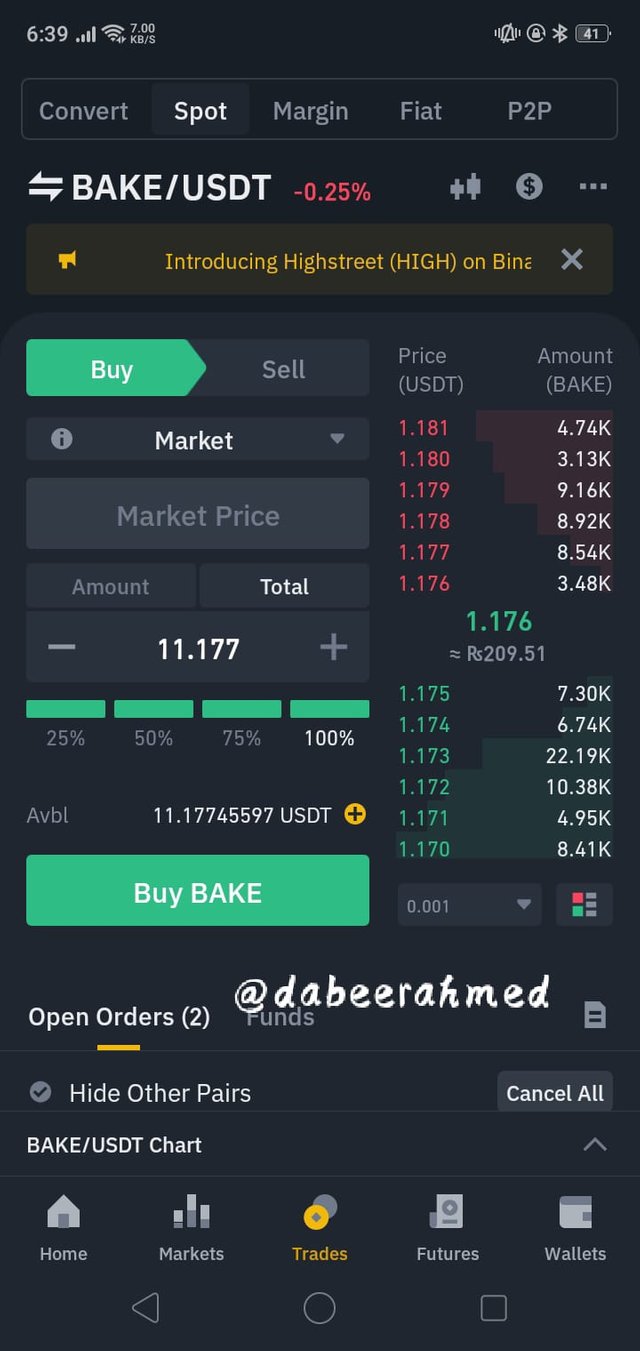
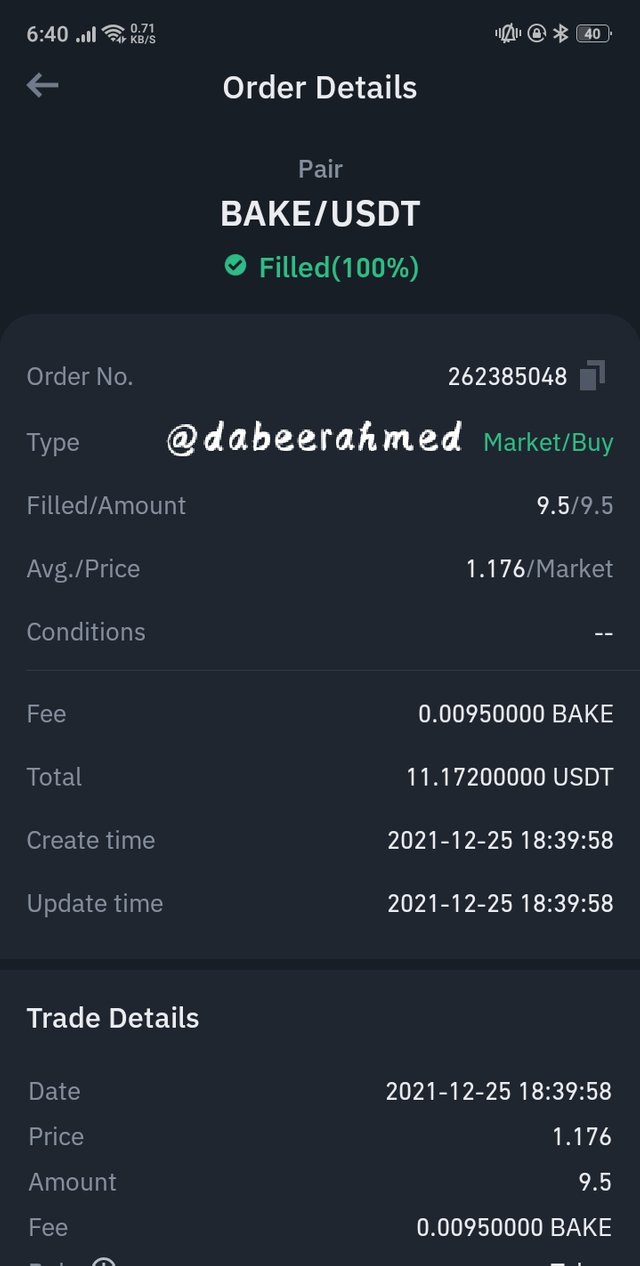
All of these indicators together provided me the confidence to place a buy order on BAKE/USD on my verified Binance exchange account. The screenshot below shows the details of transaction execution.


Conclusion

In this post, we introduced the VuManchu Cipher B indicator and its trading method, as explained in the class by professor @reddileep. The indicator is important and unique since it combines numerous different indicators into one. The wave trend indicator and the money flow indicator provide precise information on which side of the market is in control, as well as the inflow and outflow of money in the price of an asset.
However, it should be remembered that we must also be able to maximise the value of this indicator by combining it with other supporting indicators. Because, despite the fact that this indicator is a composite of many other indicators, it is not immune to misleading signals. We must exercise extreme caution while making trade decisions and combining them with other indicators.

Note : All the screenshots of charts are taken from Tradingview
Regards, @dabeerahmed
