MANA/USDT Sell | S6T4 - Team Trading Post for Fredquantum-Kouba01 Traders Team


About The Mana Token
Certainly, most people in the crypto ecosystem have come across the MANA project and how strong the coin can perform.
The MANA token is the native token of the web3 project which is enhanced by the Ethereum blockchain network. That’s means, the MANA token is an ERC-20 token.
The Decentraland works like a virtual platform that uses two different tokens. The MANA and the LAND token. Each of these tokens works differently. Since the Decentraland works on the Ethereum blockchain network, the MANA and the LAND tokens are ERC-20 and ERC-721 tokens respectively. As we are all aware, the ERC-20 tokens are fungible while the ERC-721 are non-fungible tokens. Making the LAND token an NFT. The LAND token is obtained as a result of burning the ERC-20 MANA token.
The Decentraland project was founded by Ariel Meilich and Esteban Ordano in 2015. The project initially aimed at enhancing its users to create and insight content and applications. However, due to how relevant the project has performed over the years, a lot of investors have found interest in investing in the project.
When the Decentraland project to launched in 2017, 24 million coins was first released. This was just the initial phase of the entire project. Two years later, that’s in 2019, the closed beta was launched on the platform, and later in 2020, the project was finally opened to the entire public.
Just like many other popular tokens, the MANA token can also be traded on almost all the exchange popular platforms. About 85% of the known exchange platform. This is to tell you how strong the project has been performing over the past years.
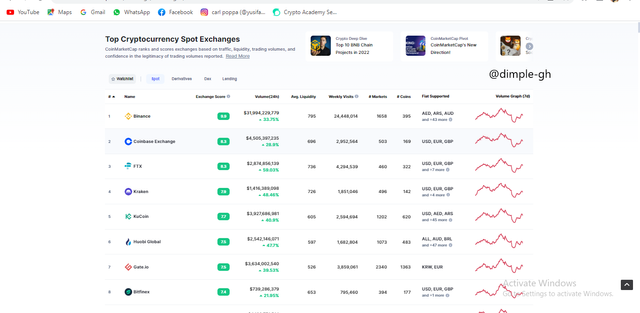
All these exchange platforms above can be used to trade the MANA token.
Price Data of MANA Token
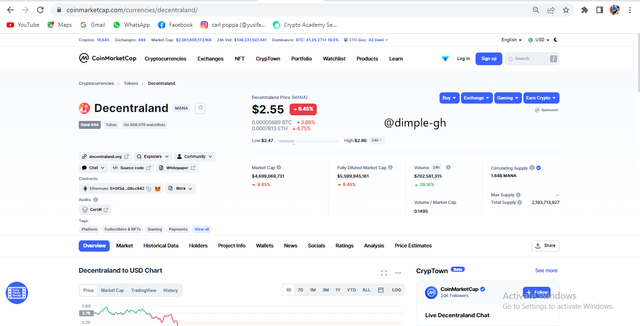
According to the Chart above, the MANA token is ranked #34 among the current altcoin rankings.
The current price at the time of the assignment is $2.55.
The current market capitalization is $4,699,069.731.
The Fully Diluted Market Cap is $5,599,945,161
The total supply of the MANA token is 2,193,713,927.
Technical analysis about Mana Token
I would make technical analyses on both longer and shorter timeframes. It is always advisable to make a complete analysis before you enter into trade.
Analysis on 1-day timeframe
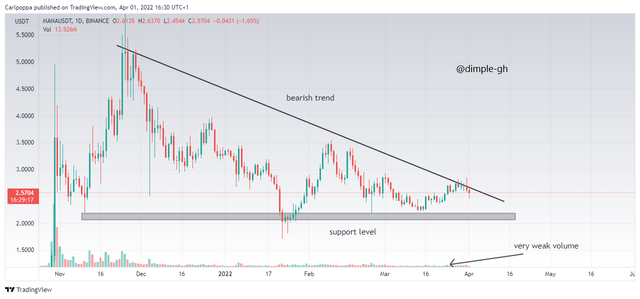
According to the 1-day timeframe chart above, the whole momentum was bearish and it’s bearish at the moment.
However, the volume in the bearish momentum is very weak which indicates that there could be a reversal since the selling pressures are weak.
The price was expected to break above the trendline just like many other altcoins are behaving currently but it’s very unfortunate for the MANA token. The price has still not broken above the trendline which gives us no confirmation of an uptrend.
The price has been rejected by the trendline which indicates a bearish trend continuation. But the weak volume also contradicts the bearish trend continuation.
Henceforth, it wouldn’t be advisable to take a swing trade with this kind of chart since there’s no confirmation yet. Even though we are all anticipating a bullish trend reversal at the end, it would be very early to take the trade now since there’s no confirmation yet.
Analysis with 4-hour timeframe
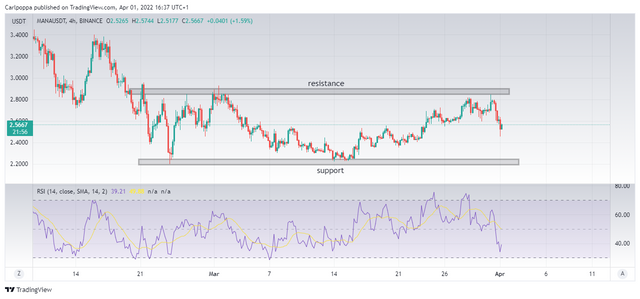
According to the 4-hour timeframe chart, the price is consolidating. The price has been rejected by the resistance level and it’s currently dropping.
Comparing this chart to the 1-day timeframe chart, we can the price has been rejected by both the trendline and the horizontal resistance line on the 4-hour timeframe chart.
This gives us no option but to assume a bearish trend.
But this is a longer timeframe chart which means the whole momentum of the MANA coin is bearish at the moment.
Analysis with 1-hour timeframe
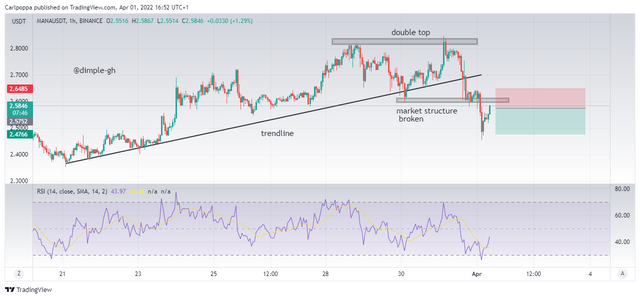
We would enter a simple sell trade. Looking at the chart above, the current price has broken below a trendline which suggests a sell trade.
Moreover, a double top was formed at the top of the trend before the breakout of the trendline. The whole market structure has been broken as well. That means the trend of the market has changed.
The RSI also stays below the 50 level which indicates a downtrend or a sell signal.
We place a stop loss just above the market structure break line and place a reasonable take profit ratio.
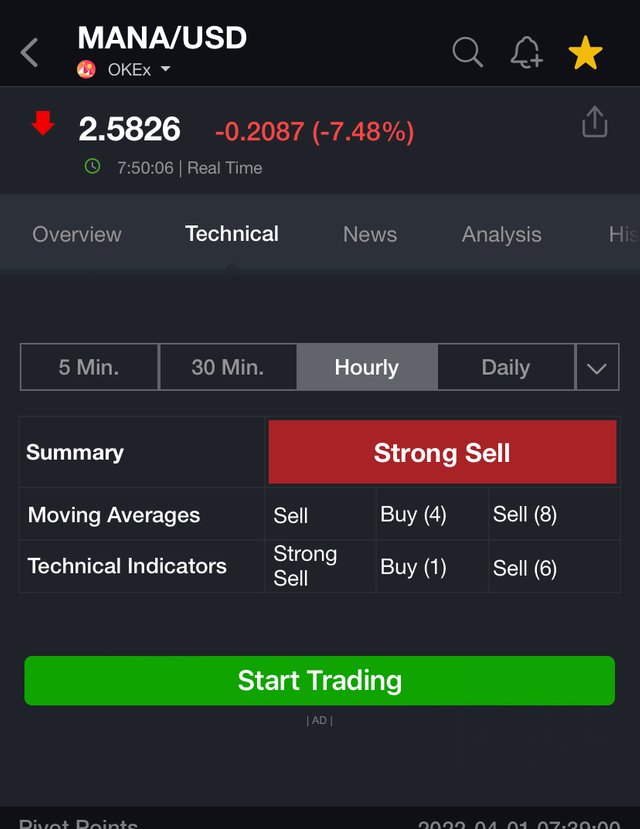
Again the Investing.com app is also communicating a sell strong sell signal on the hourly chart.
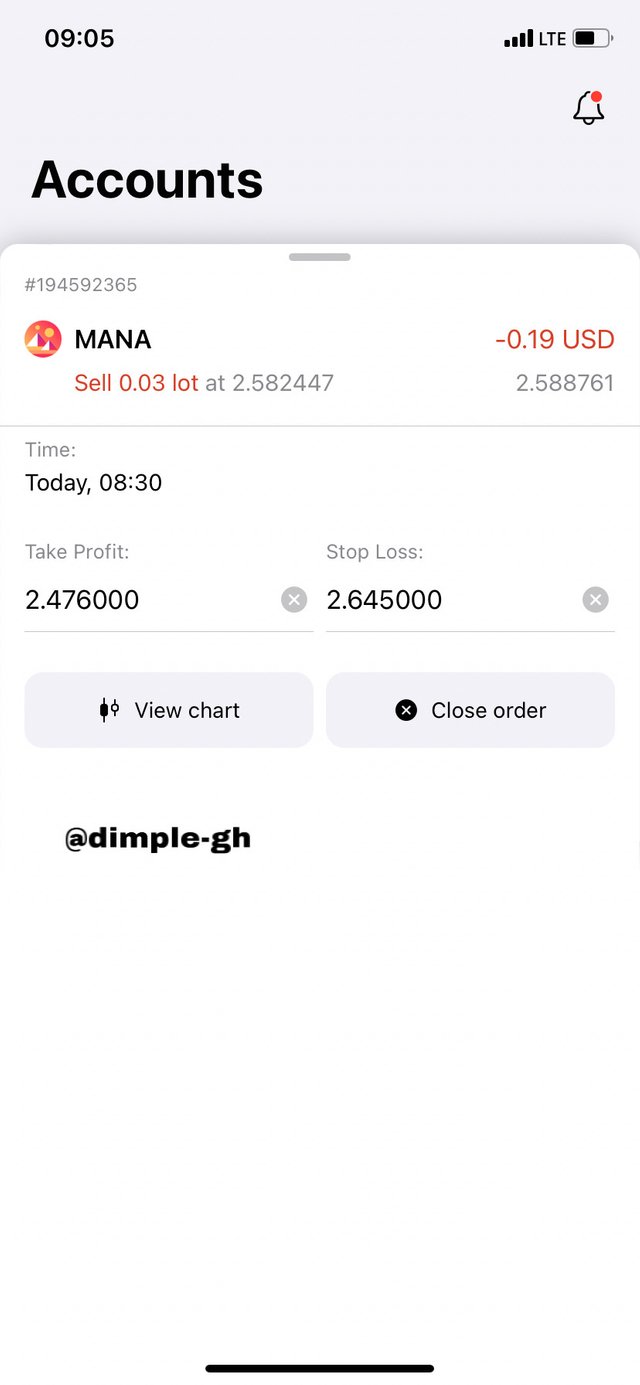
Trade placed in my Exness broker account
conclusions
Crypto trading requires in-depth knowledge about technical analysis and experience as well. Usually, inexperienced traders are mostly not successful in their trading although they may use similar strategies as the experienced traders.
This is because they lack risk management. Not long ago, I used to lose money due to fear and a weak mentality. When I place trades, I take profits on a few pips movements. But when I’m looking, I allow the trade to hit stop loss. So I realized am losing more than am gaining due to fear.
I would urge everyone to stick to a plan and stay focused as well. Don’t risk money you are not willing to lose and use good risk management.