Crypto Trading by Identifying Support and Resistance - Steemit Crypto Academy - S6W3 - Homework Post for @shemul21
Hello All Steemians !!!
Today I'm going to make my Steemit Crypto Academy Homework task by professor @shemul21 that talking about Crypto Trading by Identifying Support and Resistance. Actually I have very little knowledge about this, but on this occasion I will try to discuss it to improve my writing skills.


What is the Support & Resistance zone?
Support Zone
Support zone is the horizontal level of the cryptocurrency price movement on the chart that traders can analyze where the price is at the bottom and react to push the price up. This indicates that the price did not close below the support zone and experienced a price increases. Traders can analyze the support zone by drawing a horizontal line that combines several support points where the price does not cross the support zone.
Support zone is formed on the chart because it is influenced by the factors of market participants where many buyers make cryptocurrency transactions so that the price refuses to decrease and makes price movements in the opposite direction or price increases. Prices in the support zone are a good thing for traders to place buy orders because this is an indication of a trend reversal where the bearish trend will be bullish for a certain period of time.
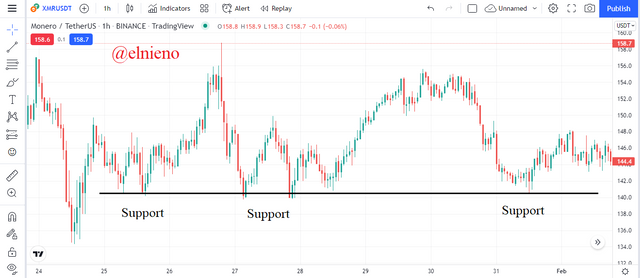
Based on the chart above, the XMR/USDT market is showing a support zone which I can analyze by drawing a horizontal line that combines several support points. The price movement created a support zone around $140 and the price failed to close below the support zone. This happens because there are many market participants who place buy orders so that the price moves upwards after reaching the support zone.
Resistance Zone
Resistance zone is the horizontal level of the cryptocurrency price movement on the chart that traders can analyze where the price is at the top and react to push the price down. This indicates that the price did not close above the resistance zone and experienced a price decreases. Traders can analyze the resistance zone by drawing a horizontal line that combines several resistance points where the price does not cross the resistance zone.
Resistance zone is formed on the chart because it is influenced by the factors of market participants where many sellers make cryptocurrency transactions so that the price refuses to increase and makes price movements in the opposite direction or price decreases. Prices in the resistance zone are a good thing for traders to place sell orders because this is an indication of a trend reversal where the bullish trend will be bearish for a certain period of time.
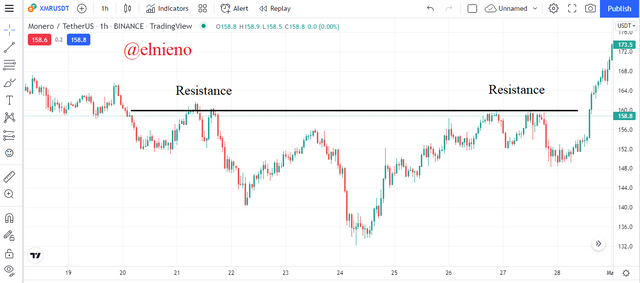
Based on the chart above, the XMR/USDT market is showing a resistance zone which I can analyze by drawing a horizontal line that combines several resistance points. The price movement created a resistance zone around $160 and the price failed to close above the resistance zone. This happens because there are many market participants who place sell orders so that the price moves downwards after reaching the resistance zone.
Explain different types of Support & Resistance with proper demonstration
Horizontal Support and Resistance
Horizontal support and resistance is an easy type and is often used by traders in technical analysis of cryptocurrency charts. Traders can identify market trends when price movements break through resistance or support levels then this is an indication of trend continuation or trend reversal. Price movements that continue to move make resistance levels can act as support levels when price movements go up and conversely support levels can act as resistance levels when price movements go down.
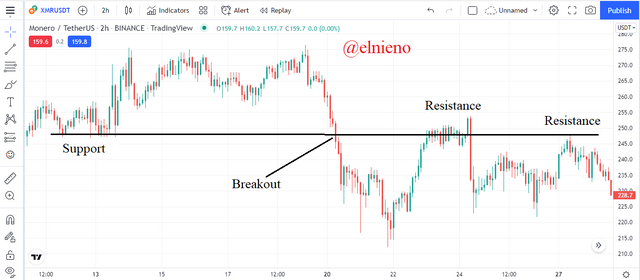
Based on the chart above, the XMR/USDT market is showing a bullish trend. I can analyze horizontal support and resistance by drawing a line that joins several points on the chart. The bullish is indicated by price movements that continue to rise and create horizontal support. The price movement that goes down and breaking through the horizontal support is an indication of a trend reversal. When the price movement retests, the support level will act as a resistance level and the downward price movement indicates a trend reversal from bullish to bearish.
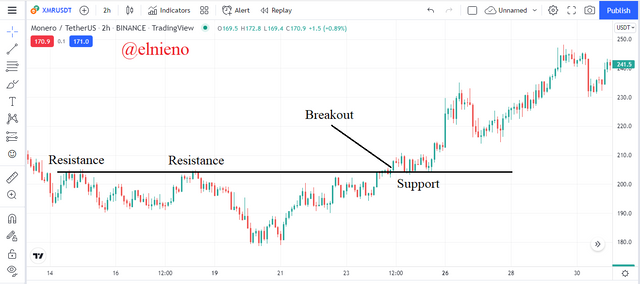
Based on the chart above, the XMR/USDT market is showing a bearish trend. I can analyze horizontal support and resistance by drawing a line that joins several points on the chart. The bearish is indicated by price movements that continue to fall and create horizontal resistance. The price movement that goes up and breaking through the horizontal resistance is an indication of a trend reversal. When the price movement retests, the resistance level will act as a support level and the upward price movement indicates a trend reversal from bearish to bullish.
Slope Levels of Support and Resistance
Slope levels of support and resistance is an easy type and is often used by traders in technical analysis of cryptocurrency charts. Traders can identify market trends when price movements show a significant increase or decrease. The diagonal line or trendline can be drawn by traders by combining several support points which indicate a bullish trend and resistance points which indicate a bearish trend.
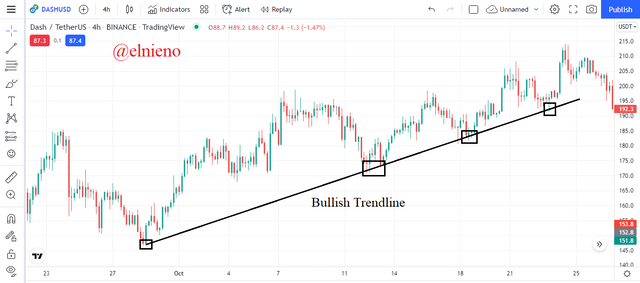
Based on the chart above, the DASH/USDT market is showing a bullish trend and a significant upward price movement. I can analyze slope levels of support by drawing a diagonal line or trendline on a chart that combines several support points. Upward price movement tends to create a new higher support point where the price will bounce once the price reaches the bullish trendline. Traders can place buy orders because the market is in a strong bullish trend and earn profits.
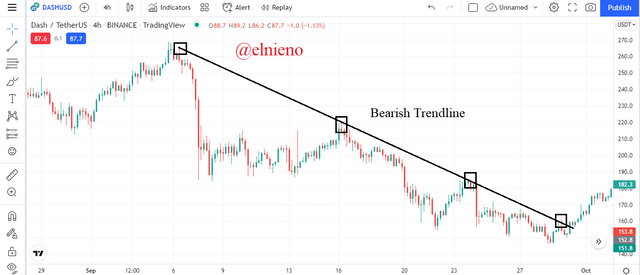
Based on the chart above, the DASH/USDT market is showing a bearish trend and a significant downward price movement. I can analyze slope levels of resistance by drawing a diagonal line or trendline on a chart that combines several resistance points. Downward price movement tends to create a new lower resistance point where the price will bounce once the price reaches the bearish trendline. Traders can place sell orders because the market is in a strong bearish trend and earn profits.
Dynamic Support and Resistance
Dynamic support and resistance is an easy type and is often used by traders in technical analysis of cryptocurrency charts. Traders can identify market trends by adding an Exponential Moving Average (EMA) indicator which shows dynamic support levels in a bullish trend and dynamic resistance in a bearish trend. The EMA can be configured according to each trader's trading strategy where the 20 EMA shows closer levels than the 50 EMA based on price movements. A higher EMA configuration can also be added to show an indication of a trend reversal.
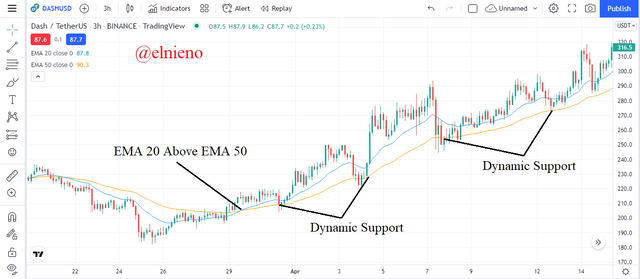
Based on the chart above, the DASH/USDT market is showing a bullish trend and an upward price movement. I can analyze dynamic support by observing the 20 and 50 EMA lines reaching the candle several times. Upward price movement tends to create a new higher support point where the price will bounce once the price reaches the dynamic support. The 20 EMA above the 50 EMA is an early indication of a bullish trend and dynamic support can be used as a reference by traders to place buy orders.
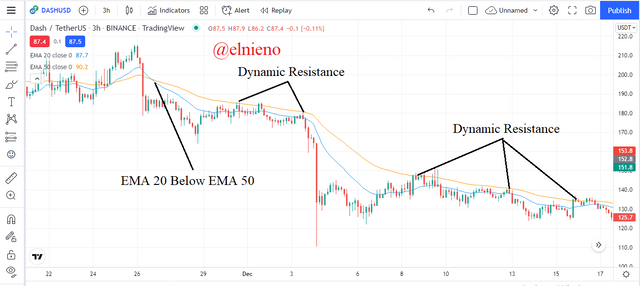
Based on the chart above, the DASH/USDT market is showing a bearish trend and a downward price movement. I can analyze dynamic resistance by observing the 20 and 50 EMA lines reaching the candle several times. Downward price movement tends to create a new lower resistance point where the price will bounce once the price reaches the dynamic resistance. The 20 EMA below the 50 EMA is an early indication of a bearish trend and dynamic resistance can be used as a reference by traders to place sell orders.
Identify The False & Successful Breakouts
Continuation Breakouts
Continuation breakout is successful breakouts that traders can analyze by observing price movements in a bullish or bearish trend. Continuation breakouts can be identified in a bullish trend where price movements show an increase that breaks through the resistance level, while in a bearish trend where price movements show a decline that breaks through the support level. The breakout that occurs indicates the market is in a strong trend based on price movements so traders can place buy or sell orders at the initial confirmation of the trend.
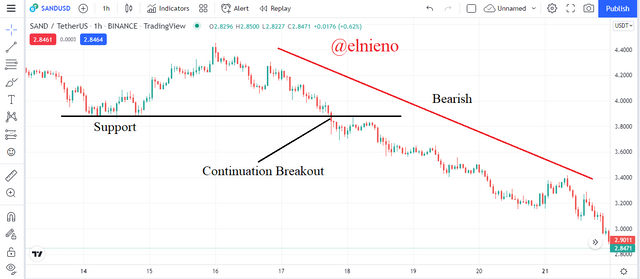
Based on the chart above, the SAND/USDT market is showing a bearish trend and falling prices are creating support levels. Over time, the price movement experienced a retest up and back down break through the support level. This indicates a continuation breakout of a bearish trend where price movements turn the support level into a new resistance level. Traders can place a sell order at the beginning of the breakout of the support level because the breakout is a confirmation.
Reversal Breakouts
Reversal breakout is successful breakouts that traders can analyze by observing price movements in a bullish and bearish trend. Reversal breakouts from bullish to bearish can be identified by observing price movements from up to down where falling price movements will break the support level of the previous bearish trend, while from bearish to bullish can be identified by observing price movements from down to up where rising price movements will broke the resistance level of the previous bullish trend. The breakout that occurs is a confirmation of a trend reversal and traders can place buy or sell orders at the start of the trend.
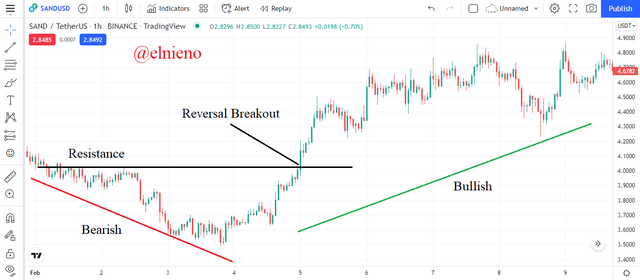
Based on the chart above, the SAND/USDT market is showing a bearish and will experience a trend reversal to bullish. Initially the price movement showed a decline and reversed which indicated an increase. A reversal breakout occurs when the upward price movement breaks the resistance level of a bearish trend and this is a confirmation of a trend reversal from bearish to bullish. Traders can place buy orders after a breakout occurs or at the start of a trend.
False Breakouts
False breakout is a market condition on a chart where the price movement fails or is unable to continue a bullish or bearish trend. A false breakout can be identified by traders in a bullish trend where price movement reverses indicating a price drop and breaking a resistance level, while in a bearish trend, price movement reverses indicating a price increase and breaking a support level. A false breakout occurs because market participants are unable to maintain the price in a certain trend so that the price reverses in the opposite direction.
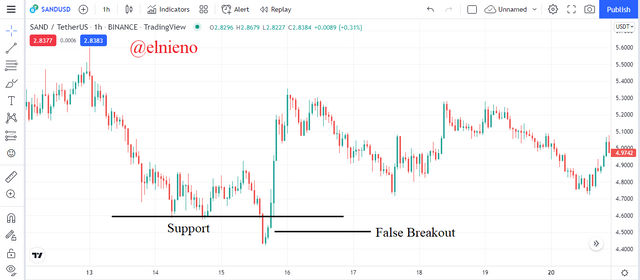
Based on the chart above, the SAND/USDT market is showing a bearish and creating a support level. The downward price movement failed or was unable to continue the bearish trend because the price reversed which indicated a price increase. The upward price movement breaks the support level and indicates the market is in a bullish trend. False breakouts occur because sellers fail to maintain prices and the high volume of buying transactions in the market makes prices rise.
Use Volume and RSI Indicator Combined with Breakouts & Identify the Entry Point
In the world of cryptocurrencies, traders can combine indicators to execute trading strategies and to place buy or sell orders at the right time. Entry points can be identified by adding the RSI and Volume indicators to produce an accurate analysis of trading using support and resistance. The RSI indicator indicates for traders to place a buy entry in an overbought position or a value above 50 and place a sell entry in an oversold position or a value below 50. The volume indicator also indicates the number of transactions that occur in the market so that high volume can be used as a reference by traders to place entry points.
Trading using support and resistance can be done with the following criteria:
Draw horizontal lines joining several points or zones of support and resistance, or with other types such as trend lines or dynamic support and resistance
Identify support or resistance breakout points
The RSI indicator shows values above 50 for buy entries and below 50 for sell entries
Analysis of trading volume showing high volume
Entry points can be placed after a breakout occurs
Setting stop loss levels and take profit levels with a ratio of 1:1 or 1:2
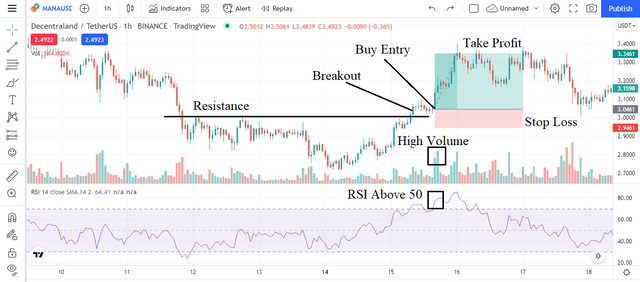
Based on the chart above, the MANA/USDT market is showing a bullish trend and rising price movements. I draw horizontal lines joining several points or zones of resistance. I identify a resistance breakout points. The RSI indicator shows values above 50 and high trading volume. I place entry points after a breakout occurs at $3.0461. I Set stop loss levels and take profit levels with a ratio of 1:2. This indicates that a buy entry can be identified by a combination of the RSI and Volume indicators.
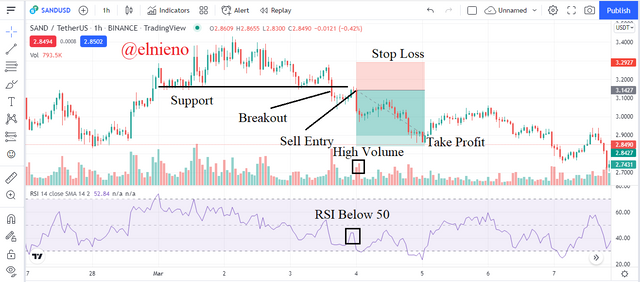
Based on the chart above, the SAND/USDT market is showing a bearish trend and falling price movements. I draw horizontal lines joining several points or zones of support. I identify a support breakout points. The RSI indicator shows values below 50 and high trading volume. I place entry points after a breakout occurs at $3.1427. I Set stop loss levels and take profit levels with a ratio of 1:2. This indicates that a sell entry can be identified by a combination of the RSI and Volume indicators.
Take a Real Trade(crypto pair) on Your Account After a Successful Breakout
Here I will trade the TRX/USDT pair by applying the lessons I have learned from the previous questions in this assignment. I will analyze the cryptocurrency market on a trading chart and identify support and resistance to place buy entries at the right time. I use the RSI indicator to support and improve the accuracy of the analysis. This is one of the trading strategies commonly used by many other traders. This is shown in the graph as follows:
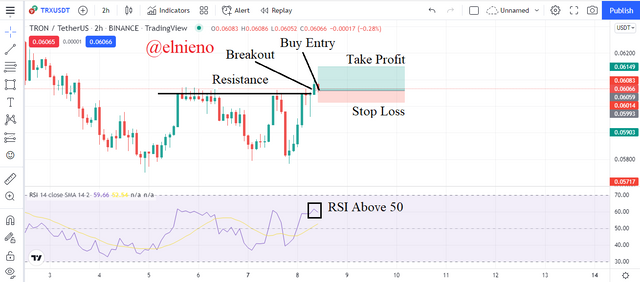
Based on the chart above, the TRX/USDT market is showing an upward price movement and indicates a possible bullish trend. I draw a horizontal line joining two resistance points or resistance zones. The upward price movement broke through the resistance zone and the breakout was successful. This is an indication that a bullish trend will occur after a bearish trend. The RSI indicator that shows a value above 50 or an overbought position indicates a trader to place a buy entry.
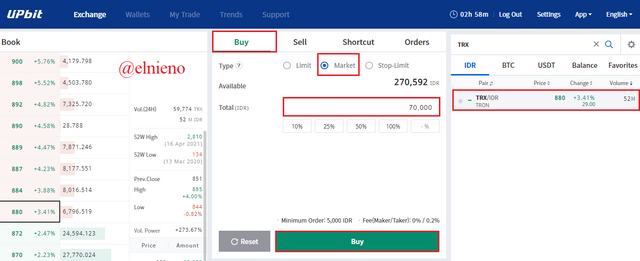
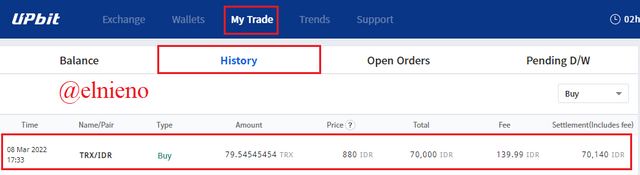
After the breakout and confirmation of the RSI indicator, I placed a buy entry on the next candle at $0.06059. I set the stop loss level at $0.06014 and the take profit level at $0.06149 with a 1:2 ratio. Here the TRX/USDT market shows an indication of a breakout reversal from bearish to bullish and I place my entry point at the beginning of the trend reversal confirmation. I placed a buy order for TRX on Upbit exchange for $5 or equivalent to IDR 70.000. Transaction details are as follows:
Explain the Limitations of Support & Resistance
In the world of cryptocurrencies, technical analysis and trading strategies carried out by traders are not always 100% successful because they have unavoidable limitations. This also includes trading using support and resistance as it sometimes gives false trading signals such as false breakouts. This is inseparable from the nature of the market and the price of cryptocurrencies which have high volatility. Several factors can influence the price movement of cryptocurrencies so that sometimes the market cannot be 100% predicted.
False breakouts occur in the market because price movements fail or are unable to continue a certain trend where price movements will reverse in the opposite direction of the trend. False breakouts can occur in a bullish or bearish trend. In a bullish trend, traders can identify a false breakout when the price movement is declining or reversing and breaking through a resistance level. In a bearish trend, traders can identify a false breakout when the price movement is increasing or reversing and breaking through a support level. The false breakout occurs due to several factors where the buyers or sellers are unable to maintain the price in a certain trend.
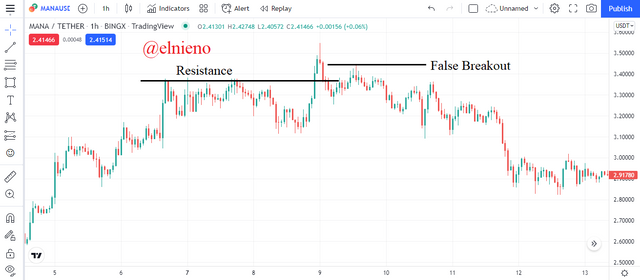
Based on the chart above, the MANA/USDT market is showing a bullish and creating a resistance level. The upward price movement failed or was unable to continue the bullish trend because the price reversed which indicated a price decrease. The downward price movement breaks the resistance level and indicates the market is in a bearish trend. False breakouts occur because buyers fail to maintain prices and the high volume of selling transactions in the market makes prices fall.
Conclusion
In the world of cryptocurrencies, support and resistance are one of the important factors that a trader must analyze before executing a trade. The support and resistance zones drawn horizontally by traders on the chart indicate price movement that will bounce in the direction according to the trend, either bullish or bearish. Support and resistance have several types with different functions and characteristics. This difference in the types of support and resistance shows that there are many ways and trading strategies that can be applied to produce accurate analysis and make profitable trades.
Trading using support and resistance can produce good trading signals or false signals. This is indicated by a successful breakout or a false breakout that will occur in the market. To support technical analysis, a combination of RSI and volume indicators can be added so that traders can identify and place entry points at the right time. Ideally, entry points can be placed after the market has experienced a breakout indicating trend continuation or trend reversal. Trading using support and resistance is believed to help traders execute good trades.