Psychology of Trends Cycle - Steemit Crypto Academy - S6W4 - Homework Post for @reminiscence01
Hello All Steemians !!!
Today I'm going to make my Steemit Crypto Academy Homework task by professor @reminiscence01 that talking about Psychology of Trends Cycle. Actually I have very little knowledge about this, but on this occasion I will try to discuss it to improve my writing skills.


Explain your Understanding of the Dow Jones Theory. Do you think Dow Jones Theory is Important in technical analysis?
Dow Jones Theory
The Dow Jones theory is one of the theories in the financial world adopted by traders which states that all activities and things that involve the market are influenced by many factors. Factors from outside and inside the market such as news and the balance of supply and demand can make price movements up or down and market trends are bullish or bearish. In this case, the cycle of market trends continues to repeat itself due to the influence of market participant activities in the market. By doing technical analysis, every trader can predict the market and price movements within a certain period of time.
The Dow Jones theory states that market psychology shows 3 phases or trends where there are bullish, bearish and sideways. In a bullish trend, price movements tend to make higher highs and higher lows. In a bearish trend, price movements tend to make lower lows and lower highs. Every market trend has an accumulation or distribution phase which makes the market trend continue its trend until there is clear confirmation of trend reversal. A bullish trend occurs when the market enters the accumulation phase and conversely a bearish trend occurs when the market enters a distribution phase.
Importance Dow Jones Theory
The Dow Jones theory is very important to be applied by every trader in technical analysis. Market trend analysis is an important factor that must be done because it is a reference that can be used to get trading signals and place entry points. Market psychology will make the cycle of market trends repeating itself because market participants control asset prices and make prices go up or down within a certain period of time. In this case, every trader will try to take advantage in the market so that the market trend will change over time.
In a bullish trend, the accumulation phase is an indication that the trend is about to start. Over time, there are times when asset prices experience a decline in price because some traders take profits. If the price movement shows an increase then this indicates a continuation of the trend or a re-accumulation phase. In a bearish trend, the distribution phase is an indication that the trend is about to start. Over time, there are times when asset prices increase in price because some traders take profits. If the price movement shows a decline then this indicates a continuation of the trend or a redistribution phase.
In your own words, explain the psychology behind the Accumulation and Distribution phases of the market
Accumulation Phase
The accumulation phase is an indication of the start of a bullish trend. This phase occurs in the market when the downward price movement reverses upwards due to the balance of supply and demand between market participants. Price movements in the opposite direction are influenced by market participants who control prices where large traders or whales are able to manipulate prices. Previously in a bearish trend, many traders sold assets so that price movements showed a decrease. At this moment, large traders or whales start to take advantage of the market by starting to buy assets at low prices.
In this case, small traders tend to follow price movements and market trends. When the price movement shows the opposite direction and an indication of a trend reversal causes the purchase of assets in the market to increase. The high trading volume of large traders or whales causes the market to be in an accumulation phase. This makes many other small traders also place buy positions for profit. Over time, the price movement will show a high rise and the market is in a strong bullish trend.
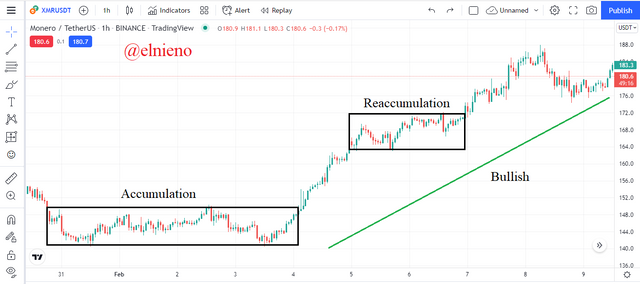
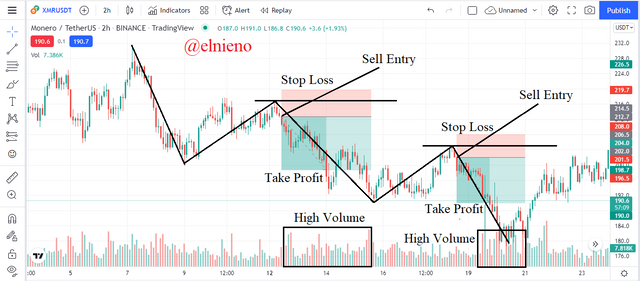
Based on to the chart above, the XMR/USDT market is showing an upward price movement and a bullish trend. This is shown based on price movements that break the accumulation zone. Over time, the price movement shows a retracement as the price begins to experience a slight decrease because large traders or whales have taken profits at the beginning of a bullish trend. This is the reaccumulation phase where traders can buy assets at low prices.
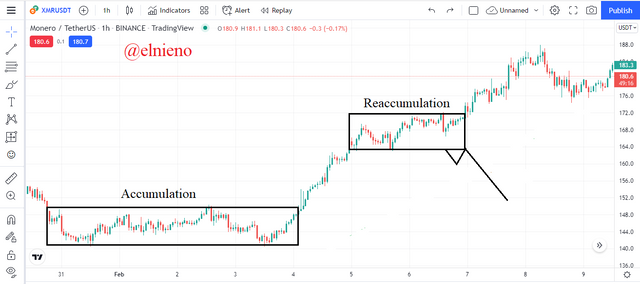
Based on the chart above, the XMR/USDT market is showing the reaccumulation phase because the upward price movement breaks the reaccumulation zone. This confirms that the market is continuing its trend being in a strong bullish trend. At this moment, some traders predict the reaccumulation phase as a trend reversal or turning into a distribution phase. This can happen if the downprice movement breaks the reaccumulation zone.
Distribution Phase
The distribution phase is an indication of the start of a bearish trend. This phase occurs in the market when the upward price movement reverses downwards due to the balance of supply and demand between market participants. Price movements in the opposite direction are influenced by market participants who control prices where large traders or whales are able to manipulate prices. Previously in a bullish trend, many traders bought assets so that price movements showed an increase. At this moment, large traders or whales start to take advantage of the market by starting to sell assets at high prices.
In this case, small traders tend to follow price movements and market trends. When the price movement shows the opposite direction and an indication of a trend reversal causes the sales of assets in the market to decrease. The high trading volume of large traders or whales causes the market to be in a distribution phase. This makes many other small traders also place sell positions for profit. Over time, the price movement will show a high fall and the market is in a strong bearish trend.
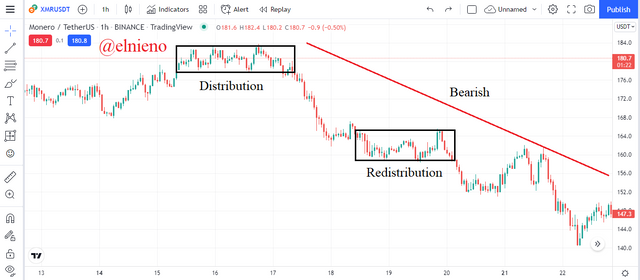
Based on to the chart above, the XMR/USDT market is showing a downward price movement and a bearish trend. This is shown based on price movements that break the distribution zone. Over time, the price movement shows a retracement as the price begins to experience a slight increase because large traders or whales have taken profits at the beginning of a bearish trend. This is the redistribution phase where traders can sell assets at high prices.
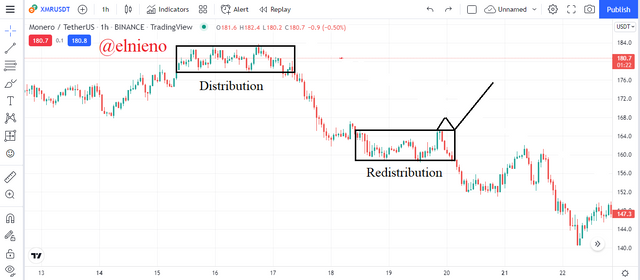
Based on the chart above, the XMR/USDT market is showing the redistribution phase because the downward price movement breaks the reaccumulation zone. This confirms that the market is continuing its trend being in a strong bearish trend. At this moment, some traders predict the redistribution phase as a trend reversal or turning into a accumulation phase. This can happen if the upward price movement breaks the redistribution zone.
Explain the 3 phases of the market and how they can be identified on the chart
Bullish Phase
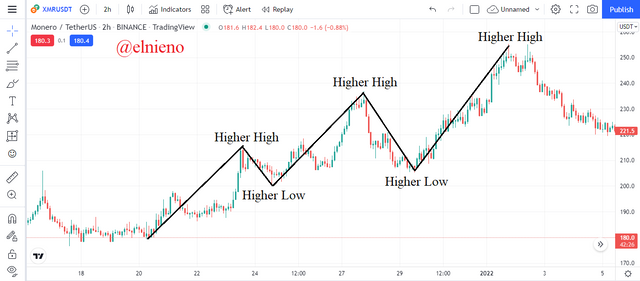
Based on the chart above, the XMR/USDT market is showing a bullish trend where the market structure forms higher highs and high lows. This is influenced by high trading volume where many buyers place buy orders and push prices higher. Price movements also show pullbacks or retracements which indicate price movements will continue to rise. During a bullish trend, traders can place buy entries for profit. Traders can analyze the bullish trend in the market based on the identification of the market structure that forms higher highs and higher lows on the chart.
Bearish Phase
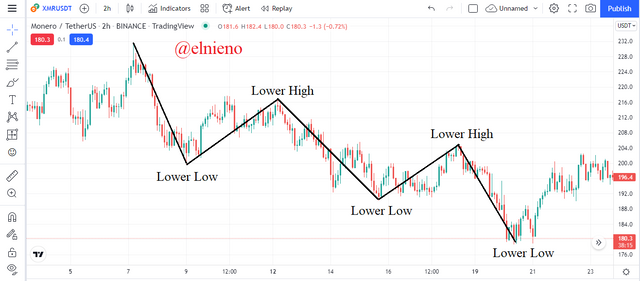
Based on the chart above, the XMR/USDT market is showing a bearish trend where the market structure forms lower lows and lower highs. This is influenced by high trading volume where many sellers place sell orders and push prices lower. Price movements also show pullbacks or retracements which indicate price movements will continue to fall. During a bearish trend, traders can place sell entries for profit. Traders can analyze the bearish trend in the market based on the identification of the market structure that forms lower lows and lower highs on the chart.
Sideway Phase
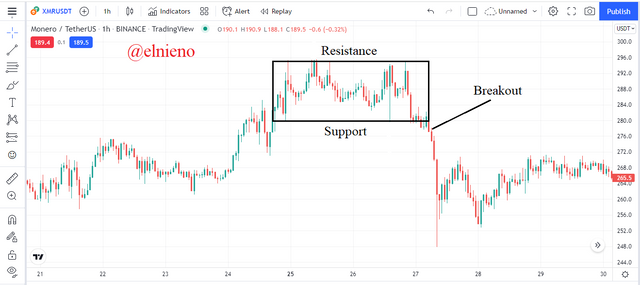
Based on the chart above, the XMR/USDT market shows a sideways trend where the market structure does not show higher highs or lower lows. Price movements do not indicate the market is in a bullish or bearish trend. A sideway trend shows price movements that bounce between support and resistance levels due to a balance between supply and demand in the market that occurs at the end of the trend or in the middle of the trend. The price movement that makes the breakout point is an indication that the trend will continue or a trend reversal.
Trend Reversal
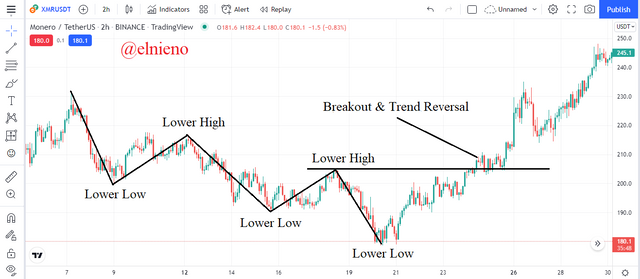
Based on the chart above, the XMR/USDT market is showing a bearish trend where the market structure forms lower lows and lower highs. A trend reversal can be identified by traders if the price movement shows an increase that breaks through the previous lower high level. This is a breakout point and confirmation of a trend reversal from bearish to bullish. This is something every trader needs to pay attention to because price movements also indicate a pullback or retracement that is in the opposite direction of the main trend. However, confirmation of trend reversal clearly occurs when there is a breakout on the chart.
Explain the importance of the Volume indicator. How does volume confirm a trend? Do this for the 3 phases of the market
Importance Volume Indicator
Volume indicator is one of the technical indicators that traders can use to analyze the current market psychology. This indicator shows high or low trading volume when the market is in a certain trend or is in the accumulation and distribution phase. This is influenced by the balance of supply and demand by market participants so that it makes price movements up or down. This indicator can be used as a reference by traders to place entry positions in the market.
Volume indicator will indicate to the trader high or low trading volume based on volatility and price movements. When the market is in the accumulation and distribution phase, price volatility tends to be low thus indicating flat volume over a period of time. This also applies to the sideway trend. However, when the market is in a strong bullish or bearish trend, price volatility tends to be high thus indicating volume up and down over a period of time. This indicator is very important in helping traders to analyze and show the psychology and current market conditions.
Bullish Phase
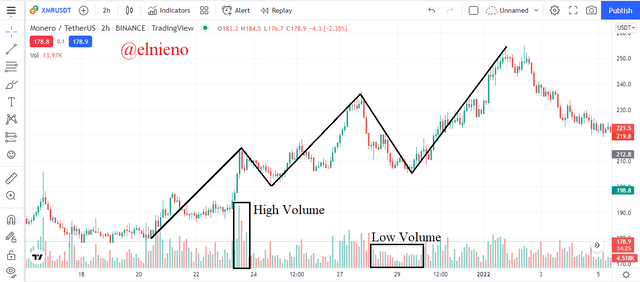
Based on the chart above, the XMR/USDT market is showing a bullish trend. During a bullish trend, the volume indicator shows high and low volumes occurring at different times. Upward price movements indicate high volatility, this indicator also shows high volume because buyers are controlling prices and there are many buying transactions that occur in the market. However, when the price movement shows a retracement or pullback, this indicator shows low volume because there are not many transactions and the market will continue the bullish trend.
Bearish Phase
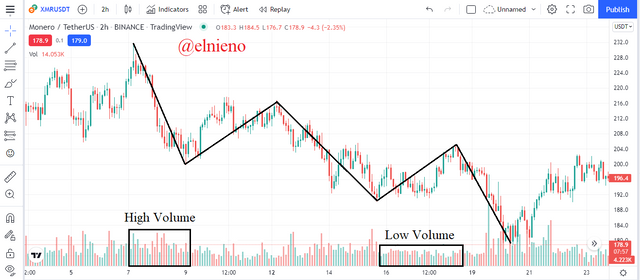
Based on the chart above, the XMR/USDT market is showing a bearish trend. During a bearish trend, the volume indicator shows high and low volumes occurring at different times. Downward price movements indicate high volatility, this indicator also shows high volume because sellers are controlling prices and there are many selling transactions that occur in the market. However, when the price movement shows a retracement or pullback, this indicator shows low volume because there are not many transactions and the market will continue the bearish trend.
Sideway Phase
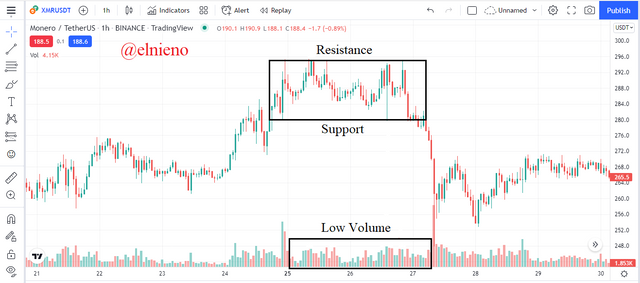
Based on the chart above, the XMR/USDT market is showing a Sideway trend. During a sideway trend, the volume indicator shows low volume because there are not many buy or sell transactions made by market participants at this moment. Price movements tend to move within a range and only bounce at support and resistance levels. This is an unsuitable time to place entry positions because trend continuation or trend reversal can be confirmed after a breakout and this indicator shows high volume.
Explain the trade criteria for the three phases of the market
Bullish Trade Criteria
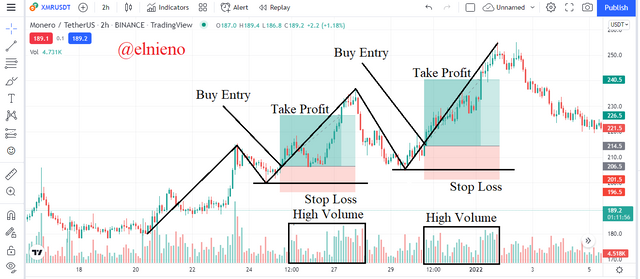
Based on the chart above, the bullish trade criteria are as follows:
Analysis the upward price movement that forms higher highs and higher lows on the chart and indicates a bullish trend. The volume indicator shows high trading volume.
Wait for the price movement to show a retracement or pullback. Analysis of rising price movements that continue the trend. Buy entry can be placed on the next bullish candle.
Set the stop loss level slightly below the higher low and the take profit level in a ratio of 1:1 or 1:2.
Bearish Trade Criteria
Based on the chart above, the bearish trade criteria are as follows:
Analysis the downward price movement that forms lower lows and lower highs on the chart and indicates a bearish trend. The volume indicator shows high trading volume.
Wait for the price movement to show a retracement or pullback. Analysis of falling price movements that continue the trend. Sell entry can be placed on the next bearish candle.
Set the stop loss level slightly above the lower high and the take profit level in a ratio of 1:1 or 1:2.
Sideway Trade Criteria
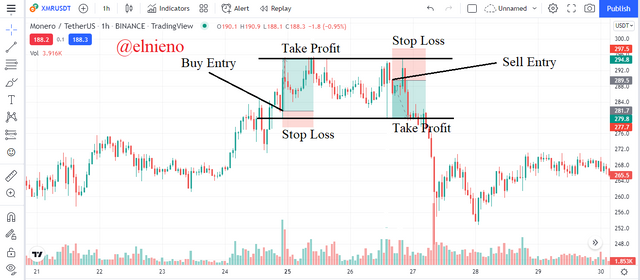
Based on the chart above, the sideway trade criteria are as follows:
Analysis of support and resistance levels showing the range. Buy entries can be placed around the support level on the bullish candle. Set the stop loss slightly below the support level and the take profit level at the resistance level.
Analysis of support and resistance levels showing the range. Sell entries can be placed around the resistance level on a bearish candle. Set the stop loss slightly above the resistance level and the take profit level at the support level.
With the Trade criteria discussed in the previous question, open a demo trade for both Buy / Sell positions
Buy SOL/USDT
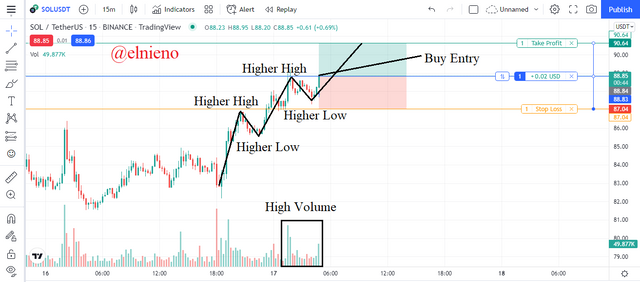
Based on the chart above, I do a demo trade for a buy position with bullish trade criteria as follows:
I analyze the SOL/USDT market which shows the upward price movement that forms higher highs and higher lows on the chart and indicates a bullish trend. The volume indicator shows high trading volume.
I am waiting for the price movement which show a retracement or pullback. I analyze rising price movements that continue the trend. I place a buy entry on the next bullish candle at $88.85.
I set the stop loss level slightly below the higher low at $87.04 and the take profit level at $90.64 in a ratio of 1:1.
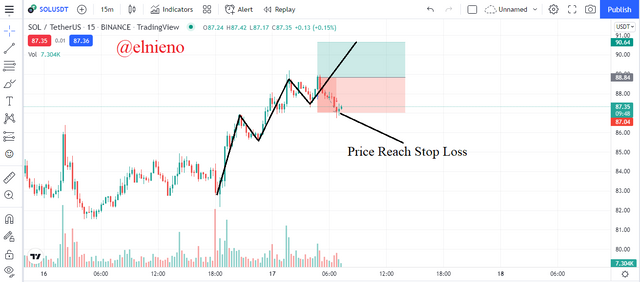
After waiting for a while, the SOL/USDT market is showing a downward price movement. This makes the price movement reach the stop loss level. At this moment, predictions and analysis do not go according to plan. Charts and transaction details on paper trading are as follows:
Sell GALA/USDT
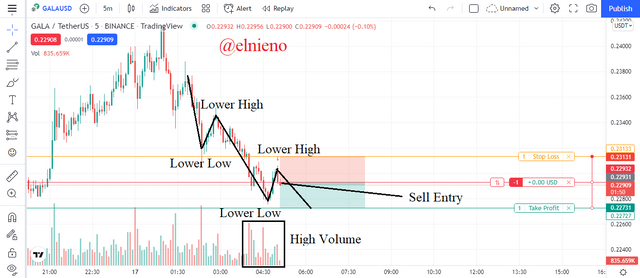
Based on the chart above, I do a demo trade for a sell position with bearish trade criteria as follows:
I analyze the GALA/USDT market which shows the downward price movement that forms lower lows and lower highs on the chart and indicates a bearish trend. The volume indicator shows high trading volume.
I am waiting for the price movement which show a retracement or pullback. I analyze falling price movements that continue the trend. I place a sell entry on the next bearish candle at $0.22931.
I set the stop loss level slightly above the lower high at $0.23131 and the take profit level at $0.22731 in a ratio of 1:1.
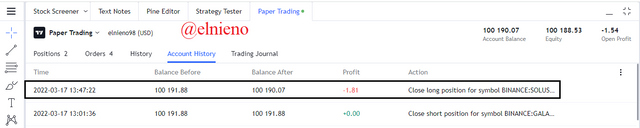
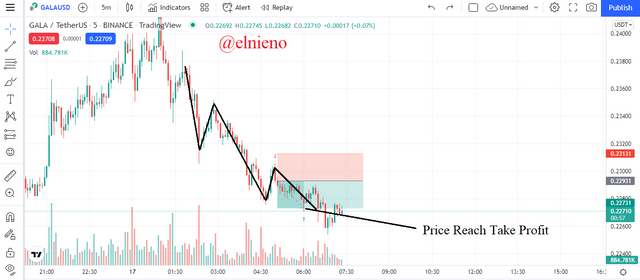
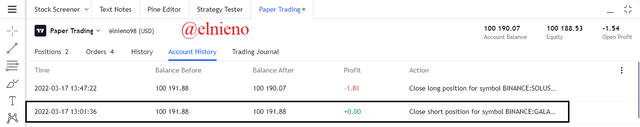
After waiting for a while, the GALA/USDT market is showing a downward price movement. This makes the price movement reach the take profit level. At this moment, predictions and analysis go according to plan. Charts and transaction details on paper trading are as follows:
Conclusion
In the world of cryptocurrencies, technical analysis in the form of market trends and market psychology is very important for traders to do before executing a trade. This is a very influential factor to be used as a reference in getting trading signals and carrying out trading strategies. Bullish, bearish and sideway trends always occur repeatedly in the market due to several factors that affect price movements and volatility such as news and supply and demand balance. The accumulation and distribution phases are an indication of the start of a trend so that it helps traders to place entry positions at the right time and is supported by volume indicators. By applying the understanding and experience that has been learned, it is hoped that every trader can execute profitable trades.
.
Hello @elnieno , I’m glad you participated in the 4th week Season 6 at the Steemit Crypto Academy. Your grades in this Homework task are as follows:
Recommendation / Feedback:
Thank you for participating in this homework task.
Thank you professoorr!!