Support and Resistance Breakouts - Steemit Crypto Academy - S6W3 - Homework Post for @pelon53
Hello All Steemians !!!
Today I'm going to make my Steemit Crypto Academy Homework task by professor @pelon53 that talking about Support and Resistance Breakouts. Actually I have very little knowledge about this, but on this occasion I will try to discuss it to improve my writing skills.


Explain in detail the advantages of locating support and resistance on a chart before trading
In the world of cryptocurrency, traders need to do several things before executing a trade, such as conducting technical analysis and executing a tyrading strategy. Analysis of support and resistance levels on cryptocurrency trading charts can help traders make profitable trades. With this, every trader can predict volatile cryptocurrency price movements and can place buy or sell entries at the right time. Analysis of support and resistance levels has the following advantages:
Market Trends
Support and resistance levels give traders an indication of price movements that will continue the trend or reverse the trend. This can happen in both a bullish and bearish market. Analysis of market trends is very important before trading because traders can predict price movements and make the right trading decisions.Entry Points
Support and resistance levels give traders an indication of price movements where traders can place entry points at favorable times. This can happen in both a bullish and bearish market. Traders can take profits by placing buy or sell orders when the market shows a strong trend and the beginning of a trend reversal.Exit Points
Support and resistance levels give traders an indication of price movements where traders can place exit points to prevent losses and take profits in the market. This can happen in both a bullish and bearish market. Traders can set a stop loss to prevent losses if the price movement does not match the prediction and take profit if the price movement does not match the prediction.Supply and Demand
Support and resistance levels provide an indication to traders regarding the balance of supply and demand that occurs in the market between buyers and sellers. This can happen in both a bullish and bearish market. When the support and resistance levels are reached, the next price movement that goes up or down is influenced by the volume of transactions made by buyers or sellers in the market.Market Psychology
Support and resistance levels give traders an indication of market psychology which will determine cryptocurrency price movements. This can happen in both a bullish and bearish market. When the price reaches a resistance level, sellers tend to control the price in the market and when the price reaches a support level, buyers tend to control the price in the market.
Explain in your own words the breaking of supports and resistances, show screenshots for the breaking of a resistance, use another indicator as a filter
Breaking of supports and resistances
Breaking of supports and resistances is a price movement that breaks through the support and resistance zone due to price movements that continue the trend or experience a trend reversal. The breakout point can usually be used as a reference by traders to place buy or sell orders when the market is in a bullish or bearish trend. The existence of a breakout provides a trading signal for traders to place entry positions and exit positions based on supports and resistances level in the market. Therefore, identifying support and resistance zones can help traders execute trading strategies that can maximize profits and minimize losses.
Breaking of resistances and retest
Breaking of resistances and retests is an upward price movement that breaks a resistance level which indicates the market will continue the trend or reversal of the trend. This has indicated that the market is experiencing a breakout. Over time, the price movement will go back down and retest within a certain period of time. This indicates that the previous resistance level has become a new support level. Upward price movement will confirm the market is in a bullish trend. I use the RSI indicator to filter and improve analysis accuracy.
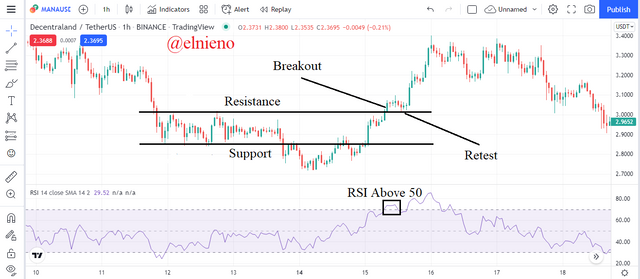
Based on the chart above, the MANA/USDT market shows an upward price movement that broke through the resistance level. After some time, the price movement shows a retest and turns the previous resistance level into a new support level. Here I use the RSI indicator which shows a value above 50 which indicates to the trader a buy signal and the market is in a bullish trend. Traders can place entry points on several candles after the breakout points. Traders can set stop loss slightly below the previous resistance level and take profit in a 1:1 or 1:2 ratio.
Breaking of resistances and continuation
Breaking of resistances and continuation is an upward price movement that breaks the resistance level which indicates the market will continue the trend or is in a strong bullish trend. This has indicated that the market is experiencing a breakout. The upward price movement continues without a retest of the previous resistance level which has been broken. Over time, the price movement will go back down or retest to gain momentum and continue the bullish trend. I use the RSI indicator to filter and improve analysis accuracy.
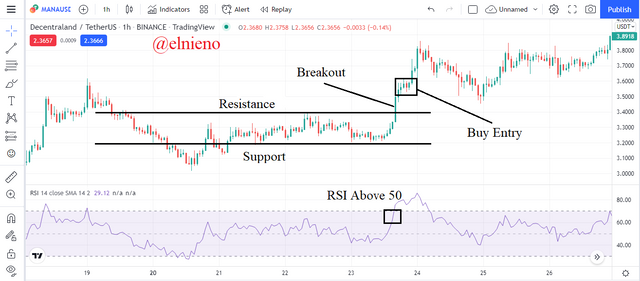
Based on the chart above, the MANA/USDT market shows an upward price movement that broke through a resistance level with high volume and without any retest of the previous resistance level. After some time, the price movement shows a retest to gain momentum and indicates the market is in a strong bullish trend. Here I use the RSI indicator which shows a value above 50 which indicates to the trader a buy signal. Traders can place entry points on several candles during the retest moment. Traders can set a stop loss slightly below the previous resistance level and take profit in a 1:1 or 1:2 ratio.
Show and explain the break of a support, use an additional indicator as a filter
Breaking of supports and retest
Breaking of supports and retests is donward price movement that breaks a support level which indicates the market will continue the trend or reversal of the trend. This has indicated that the market is experiencing a breakout. Over time, the price movement will go back up and retest within a certain period of time. This indicates that the previous support level has become a new resistancet level. Downward price movement will confirm the market is in a bearish trend. I use the RSI indicator to filter and improve analysis accuracy.
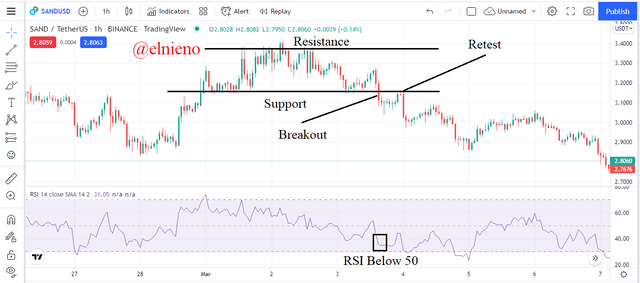
Based on the chart above, the SAND/USDT market shows a downward price movement that broke through the support level. After some time, the price movement shows a retest and turns the previous support level into a new resistance level. Here I use the RSI indicator which shows a value below 50 which indicates to the trader a sell signal and the market is in a bearish trend. Traders can place entry points on several candles after the breakout points. Traders can set stop loss slightly above the previous support level and take profit in a 1:2 ratio.
Breaking of supports and continuation
Breaking of supports and continuation is downward price movement that breaks the support level which indicates the market will continue the trend or is in a strong bearish trend. This has indicated that the market is experiencing a breakout. The downward price movement continues without a retest of the previous support level which has been broken. Over time, the price movement will go back up or retest to gain momentum and continue the bearish trend. I use the RSI indicator to filter and improve analysis accuracy.
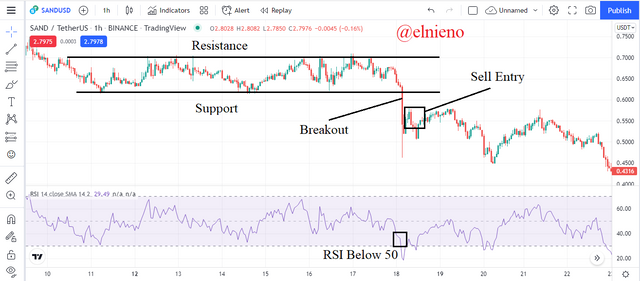
Based on the chart above, the SAND/USDT market shows a downward price movement that broke through a support level with high volume and without any retest of the previous support level. After some time, the price movement shows a retest to gain momentum and indicates the market is in a strong bearish trend. Here I use the RSI indicator which shows a value below 50 which indicates to the trader a sell signal. Traders can place entry points on several candles during the retest moment. Traders can set a stop loss slightly above the previous support level and take profit in a 1:2 ratio.
Explain what a false breakout is and how to avoid trading at that time
False Breakout
False breakout is a market situation that indicates the price movement failed or was unable to continue the current trend because the price movement indicated a reversal in the opposite direction of the current trend. The volatile cryptocurrency market and prices make false breakouts possible at any time in either a bullish or bearish trend. To avoid false breakouts, traders can analyze support and resistance with a combination of other indicators such as RSI, ADX, EMA and others so that the resulting analysis will be more accurate. Analysis of support and resistance breakouts that show a retest and continue is very important to prevent possible false breakouts.
Traders can identify a false breakout in a bullish trend where the price movement will indicate a decline through the resistance level. Traders can identify a false breakout in a bearish trend where the price movement will show an increase that breaks the support level. This happens because market participants control the price where buyers or sellers are unable to maintain the price in the current trend and a trend reversal occurs.
Bullish False Breakout
Bullish false breakout occurs when the price movement shows a decrease and breaks the resistance level when the market is in a bullish trend. This indicates that the price movement failed or was unable to continue the bullish trend and indicated a trend reversal to become bearish. This happens because market participants are controlling the market where buyers fail to maintain prices and the volume of transactions carried out by sellers makes prices fall and trend reversals.
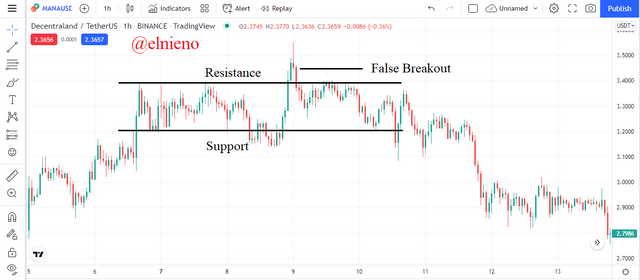
Based on chart above, the MANA/USDT market is showing bullishness and creating resistance levels. The upward price movement failed or was unable to continue the bullish trend because the price movement showed a decrease. The downward movement of the price broke the resistance level and indicated the beginning of a bearish trend. False breakouts occur because buyers fail to maintain prices and the high volume of selling transactions in the market causes prices to fall and trend reversals.
Bearish False Breakout
Bearish false breakout occurs when the price movement shows an increase and breaks the support level when the market is in a bearish trend. This indicates that the price movement failed or was unable to continue the bearish trend and indicated a trend reversal to become bullish. This happens because market participants are controlling the market where sellers fail to maintain prices and the volume of transactions carried out by buyers makes prices up and trend reversals.
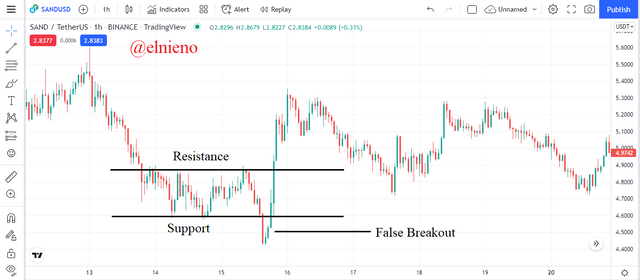
Based on chart above, the SAND/USDT market is showing bearishness and creating support levels. The downward price movement failed or was unable to continue the bearish trend because the price movement showed an increase. The upward movement of the price broke the resistance level and indicated the beginning of a bullish trend. False breakouts occur because sellers fail to maintain prices and the high volume of buying transactions in the market causes prices to up and trend reversals.
Execute a trade when there is a resistance breakout, do your analysis
Based on the lessons learned from the previous question, here I am analyzing the ADA/USDT market which shows a resistance breakout. By using a shorter time frame of 5 m, I can analyze price movements that break through resistance levels to place entry points.
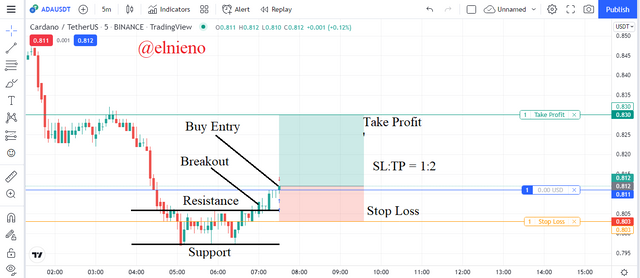
Based on the chart above, the ADA/USDT market is showing an upward price movement that broke through resistance levels and a bullish trend. I drew the line of the support and resistance level zones and showed the breakout points. The breakout point indicates a possible reversal from bearish to bullish and I predict this is a breaking of resistance and continuation. The next few candles show price movement picking up momentum and continuing the bullish trend.
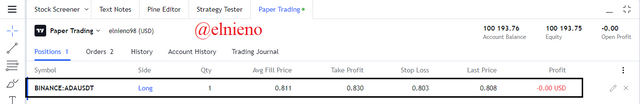
I placed a buy entry after the breakout point and the next few bullish candles at $0.812. I set the stop loss level at $0.803 slightly below the resistance level and the take profit level at $0.830 with a 1:2 ratio. Stop loss settings are very important because considering the cryptocurrency market is very volatile so it can prevent losses if price movements do not match predictions. Here I use demo trading on the tradingview platform and the details of the transaction are as follows:
Execute a trade when there is a support breakout, do your analysis
Based on the lessons learned from the previous question, here I am analyzing the LTC/USDT market which shows a support breakout. By using a shorter time frame of 5 m, I can analyze price movements that break through support levels to place entry points.
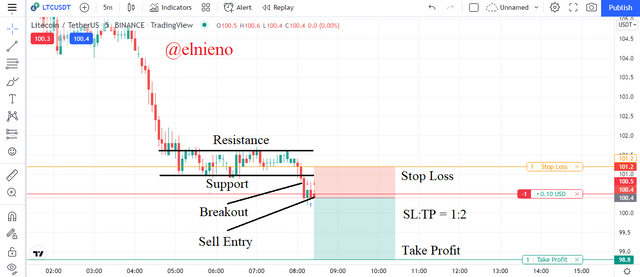
Based on the chart above, the LTC/USDT market is showing a downward price movement that broke through support levels and a bearish trend. I drew the line of the support and resistance level zones and showed the breakout points. The breakout point indicates a continuation of the strong bearish trend and I predict this is a breaking of support and continuation. The next few candles show price movement picking up momentum and continuing the bearish trend.
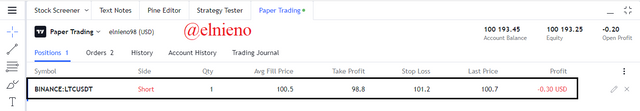
I placed a sell entry after the breakout point and the next few bearish candles at $100.4. I set the stop loss level at $101.2 slightly above the support level and the take profit level at $98.8 with a 1:2 ratio. Stop loss settings are very important because considering the cryptocurrency market is very volatile so it can prevent losses if price movements do not match predictions. Here I use demo trading on the tradingview platform and the details of the transaction are as follows:
Conclusion
In the world of cryptocurrency, support and resistance analysis plays a very important role as a form of technical analysis and trading strategy that traders need to do before executing a trade. This analysis has a very significant advantage and has a positive impact by providing important information about the current cryptocurrency market and prices. Analysis break of support and resistance indicating a retest and continuation can be identified by the trader on the chart to place profitable entry and exit points. And the use of a combination of other indicators can help traders to avoid possible false breakouts. This will allow traders to execute successful trades by maximizing profits and minimizing losses.