Crypto Academy / Season 3 / Week 7 - Homework Post for Professor @yousafharoonkhan
Hi Steemians, this is my assignment post for Professor @yousafharoonkhan on TradingView.
Question no 1:
Defining the TradingView site and how to register an account in tradingview? what are the different registration plan?(screenshot necessary)
Tradingview.
It is an online community that enables investors and individuals that has interest to learn about market. Here, users can learn from published ideas to enhance there trading strategies. They run one of the most well equipped charts base on tools, indicators and other great features that make their chart well equipped.
Tradingview has also made it possible for educators to share their knowledge on market strategies, techniques and methods to help participants improve on their skills and much more.
How To Sign-up to TradingView.
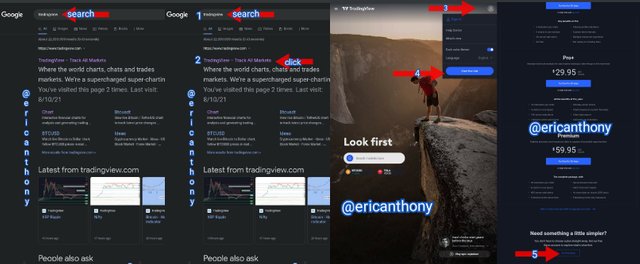
To register an account in TradingView first, we have to google TradingView, the address is usually in the first column.
As you launch the website you will see at the top right corner, a human passport-like icon. When you tap on it, at the bottom drop-down, click on the start free trial.
As you open the start free trial, you will see **plans for every level of ambition/interest. Here, you make your choice base on the plans that suits you.
The plans includes:
- Pro.
This plan requires $14.95 subscription fee per month.
It has the following key benefits;
a. 5 indicators per chart
b. 2 charts in one window
c. 20 server-side alerts
d. Ad-free
e. Volume profile indicators
f. Custom time intervals
g. Multiple enhanced watchlists
h. Bar replay on intraday bars
TradingView
- Pro+.
This plan requires $29.95 subscription fee per month.
It has the following key benefits:
a. 10 indicators per chart
b. 4 charts in one layout
c. 100 server-side alerts
d. 2 devices at the same time
e. Intraday exotic charts
f. Charts based on custom formulas
g. Chart data export
h. Indicators on indicators
TradingView
- Premium.
This plan requires $59.95 subscription fee per month.
It has the following key benefits.
a. 25 indicators per chart
b. 8 charts in one layout
c. 400 server-side alerts
d. 5 devices at the same time
e. Second-based intervals
f. Alerts that don't expire
g 4 times extra data on the charts (20K bars)
h. Publishing invite-only indicators
TradingView
However, there's a free basic plan at the bottom. It can be used to have access and to explore the TradingView website.
Now, for the purpose of this assignment, I will be using this free basic plan.
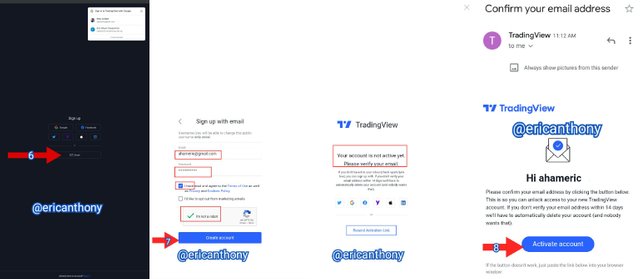
As you click on the free basic plan, you will be launched into a sign-up section. Here, you have options to sign-up with any of the following accounts: Google, Yahoo, Facebook etc.
However, I used email option
Having clicked on the email, it will launch you into a dialogue box were you fill in your details like.
- Your preferred username
- Email address
- Password
Then, tick on the terms of use, captcha and finally on Create account
After which, a verification link is sent to your email address.
All you have to do next, is to go to your email and click on the activate account
Congratulations, your TradingView account has been created.
Question no 2:
Explain the different features of tradingView and what is your favorite feature and why?(screenshot necessary)
TradingView has lots of useful features just at the homepage which has made trading educating and conveniently easier to trade. Some of the main type of the features include: Screener, Community, Market, Trade, Chart etc.
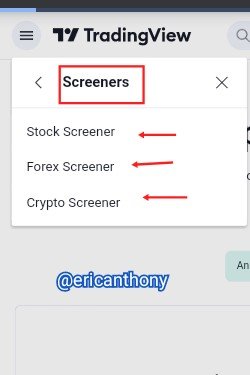
Screener
This feature makes it possible to screen, thereby making it faster to obtain your desired result in no time. Here, there are three options of screeners; Stock Screener, Forex Screener and Crypto Scrrener.
Cryptocurrencies is a subsection of market feature. It provides you the live updates coins on sales status.
The Market feature in general offers an overview of all the market options.
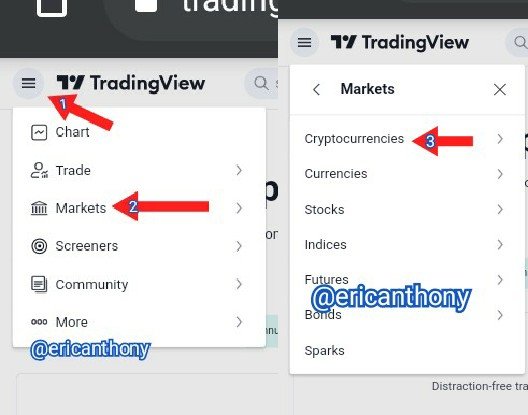
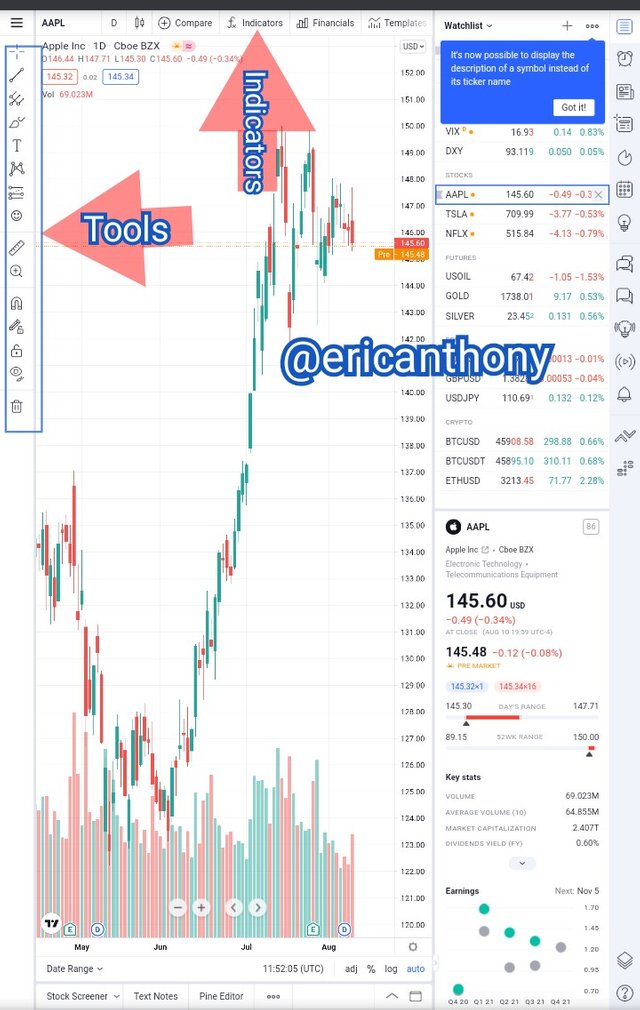
Chart:
This feature is very helpful in technical analysis and also when carrying out a trade. The user can employ different kinds of tools and indicators to perfect whatever plan/strategy he/she wants.
There is also some other important features like Community where the users can learn something from professionals, traders and also get some important updates.
The Trade feature offers the user's the opportunity to access top world brokers for an update of their interest.
My favorite feature is the Chart.
If not the chart what else.
I will say chart is the mother/ platform for all trades. It doesn't just provide us with the market trends but, also a platform where we can deploy all forms tools and indicators to perfect both entry and exit strategies.
Question no 3:
How to set up a chart in TradingView and use two tools to edit it.(screenshot necessary)
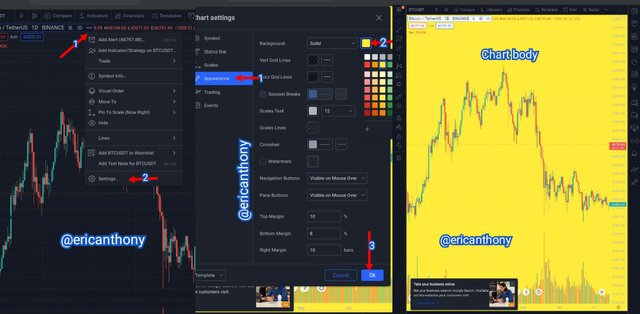
To setup chart in the TradingView, one has to click on the menu logo and then click on chart on the drop-down menu, just as demonstrated in the screenshots.
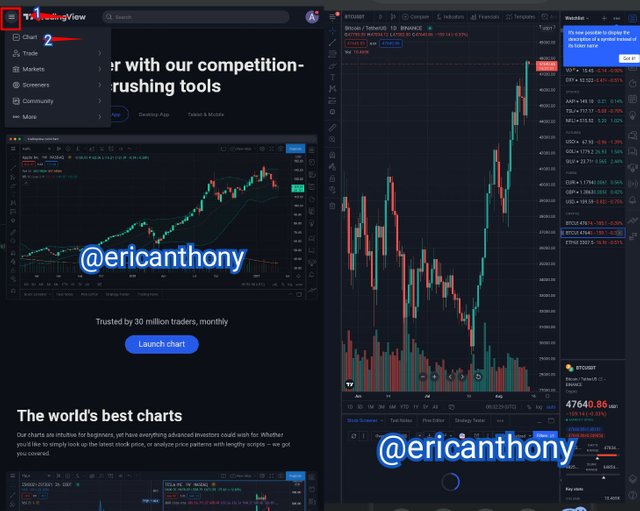
Chart Edit.
Here I used the Horizontal Line Tool to mark my entry and exit lines and also used Text Tool to write it in words.
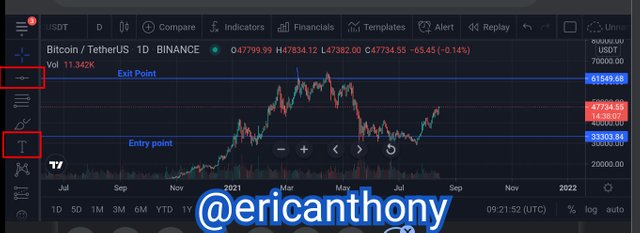
Chart Background Appearance
The chart Background appearance can also be changed to the color you want. Just as just as demonstrated in the screenshot.
Question no 4:
Explain how to add indicator in chart, what is your your favorite indicator and why? (screenshot necessary)
Here, I used three Moving Average Indicators, just as you have demonstrated in the lecture.
Moving Average Indicators are used to predict market trends.
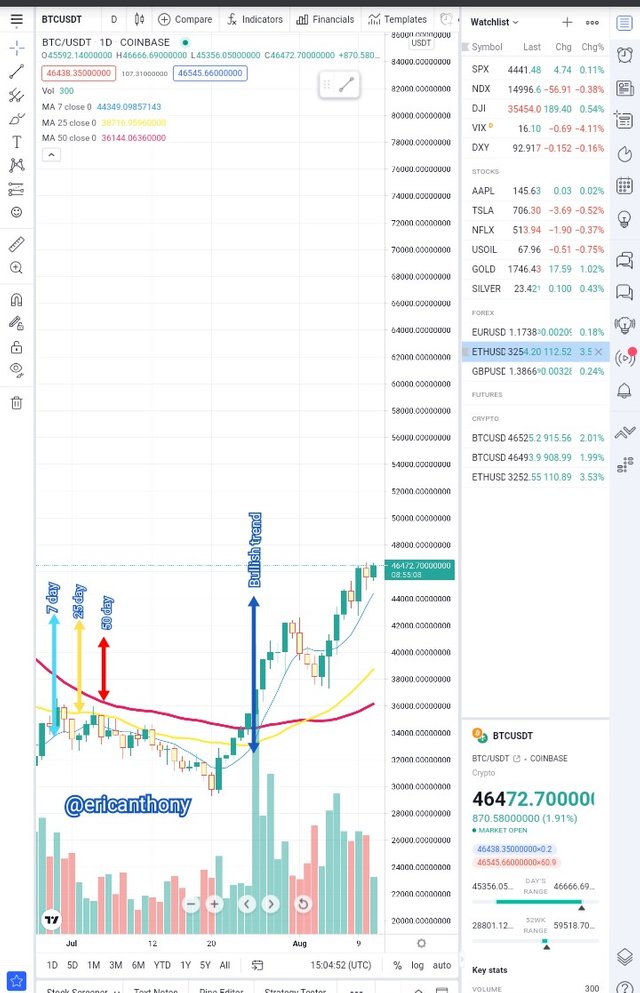
For this demonstration. I used the length of 7 days, 25 days and 50 days MAs.
Usually, when the 7 days line crosses above the 25 days, 50 days lines and the 25 days line also crosses above the 50 days line, is an indication of a strong entry signal.
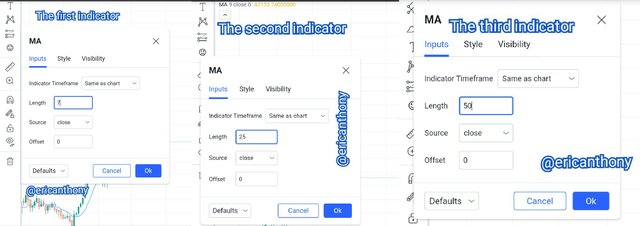
This is what it looks like.
My Favorite Indicator.
MACD is my favorite indicator because, it shows you the trend, as well as the momentum of the trend.
At a glance, you will be able to see when a trend is weakening or strengthening. It is one single indicator that gives traders a kind of clarity on a moving trend.
Question no 5:
Do you think TradingView is useful in predicting the market for cryptocurrency (trend / price)?
Of course yes. TradingView has great features especially, the Indicators that the users can deploy to achieve far over 50% prediction accuracy. Just as I have mentioned of MACD, where the traders can take advantage of the strength of the momentum of a given trend to make a better prediction on the price movement. And so much more.
6 Conclusion
I must say that this is a very educative lecture. Thanks to Crypto Professor @yousafharoonkhan for this wonderful piece of lecture.
Now I can see TradingView in a different light, that it has much far more than chart platform.
TradingView is a platform that incorporates good numbers of useful indicators, tools and community where users can get informed/updated on strategies and so much more.
Respected first thank you very much for taking interest in SteemitCryptoAcademy
Season 3 | intermediate course class week 7
you explained well but need more to explore the answer main points
thank you very much for taking interest in this class
Thank you professor @yousafharoonkhan. I really appreciate.