BTC chart review July 26th @ 20:00 PST

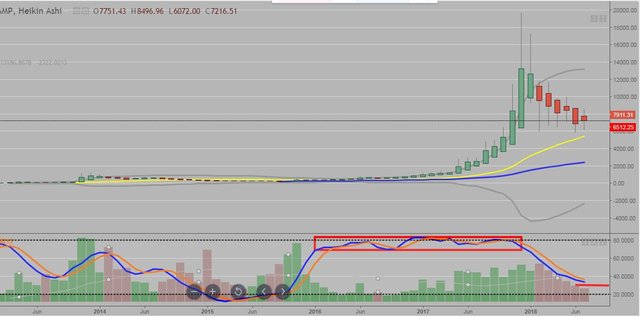
The monthly chart of BTC from Bitstamp is still bearish as it has printed 6 consecutive red heikin ashi bars illustrating the downtrend.
It is still above the 20 month moving average which is a good sign.
Stochastics appear to be leveling off, has the low for 2018 been printed?

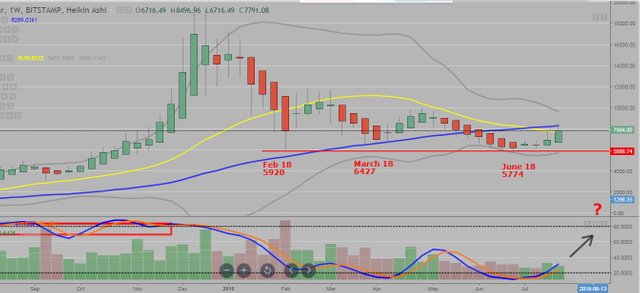
The weekly chart looks better with a few green heikin ashi bars indicating a reversal in price.
It has retested the February low during June which which is technically a double bottom. (This does not mean that it cannot go lower)
Stochastics have produced a nice reversal from the oversold area. It would be great for the bulls if the upwards trend should continue and push stochastics to the overbought area for a completion of the cycle.

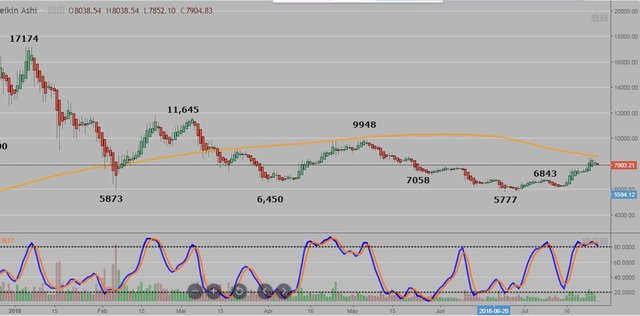
The daily chart is from the Gdax exchange and it has recently printed higher highs. We will soon see if it will be printing higher lows for a typical upwards trend.
The 200 day moving average in orange may provide some resistance. It has not been over the 200 dma since March of this year.

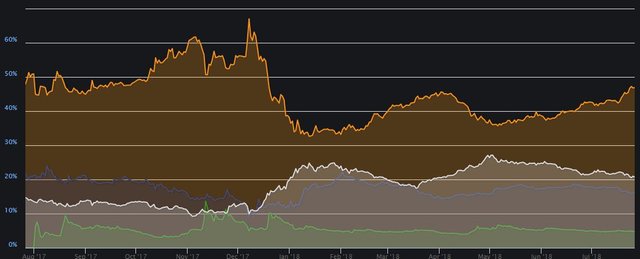
Marketcap dominance chart is from the coinmarketcap site. Money is flowing into BTC and not in the 'alt' coins (white line), or ETH (blue line). BCH is flat.

IF the lows for 2018 have been printed, BTC may grind it's way up through the rest of 2018 to the end of the year. The worst case scenario for those that are bullish would be for price to drop below the June 18 lows. Keep your eye on the charts!
Preety good explanation.see what will happen in next week or month..i m preety much bullish about crypto in future..
Hi @glennolua I came to your post because your psot appeared in my steemworld.org
I am in the process to tidy up my record and I have lost rack which auto trail I have followed.
May I know which trail did you followed such that I have auto upvoted your post.
I appreciate your response
btw, I have followed you because I wanted to learn about cryptocurrency
Thanks