Steemit crypto Academy season 4 Beginners course-Task10:Japanese candlestick patterns By @hajiataiba
INTRODUCTION
Hello steemians, I am very happy to write my homework post for this week and also using this opportunity to say a very big thank you to prof @reminiscence01 for this wonderful lecture this week.
Picture edited by myself
1a) Explain the Japanese candlestick chart? (Original screenshot required).b) In your own words, explain why the Japanese Candlestick chart is the most used in the financial market.c) Describe a bullish and a bearish candle. Also, explain its anatomy. (Original screenshot required)
Explain the Japanese candlestick chart? (Original screenshot required)
Japanese candlestick chart is that shows the price of various crypto assets in the crypto ecosystem( the rise and fall of prices).
The name called Japanese Candlestick is originated in Japan far back in 1700s by a rice trader called Munehisa Homma.
And everything was based on how he understands the law of demand and supply, how prices changes and it's effect on the market this lead to the sucessuful formation of this candle stick chart.
The japanese candle stick shows the impact of the investors on the financial market and this candle stick is used by technical analyst to decide when to enter or exit a position or trade. This candle stick chart is used by traders.
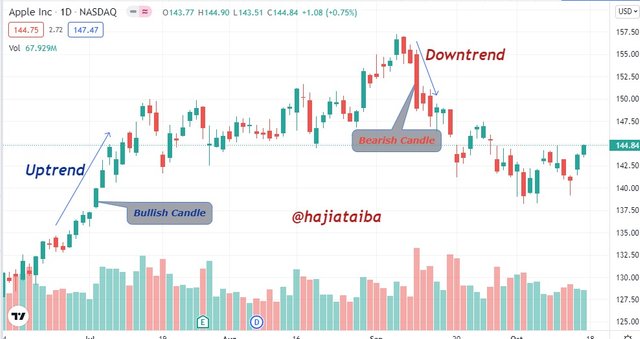
Moreover, the prices of cryptocurrencies are been shown graphically in the crypto market. They are seem in the forms of candles which are known to the Japanese type of Candles. The candles are made buyers and sellers for demanding and suppling of a crypto asset. They are then presented in the graph chart within a time period.
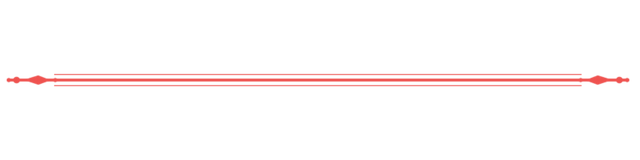
The Japanese Candlestick is made up of so many parts, and the parts are, Closing Price, closing price, Maximum and Minimum Price as well as Body and Shadow.
Moreover, The Japanese Candlesticks is very easy to use and asset it and also, it is very simple to analyze and understand. From the Japanese candlesticks, one can be able to know the price state of a crypto asset and the demand or supply of it.
b) In your own words, explain why the Japanese Candlestick chart is the most used in the financial market.
The Japanese candlestick chart is the most used chart in the crypto market. It gives a nice and a very accurate detail of every changes in price over time. Moreover, It conveys patterns and is the primary tool for price action trading and technical analysis. Below are Some of the reasons why the Japanese candlestick it is widely used;
- Identification of Price: users are able to identify price very quickly and easily because of The colors and shapes of candlesticks. Also, it is very easy to know the bulls which have a momentum and with this, it help in trading decision making.
- Easy Identification of Market Patterns: the Japanese candlestick charts, shows so many patterns which cannot be seen so easy. Example of pattern that cannot be seen so easily is doji. It is very difficult or let me just say impossible to be seen on a graph.
- Market direction: with the help of the Japanese candlestick chart, it very easy for users to identify or see the direction of the market. This is a sense that, the shapes, the Colors of the candlesticks helps buyers and sellers to determine the market direction. Also, one can easily see the uptrend, downtrend, upswing and downswing etc.
c) Describe a bullish and a bearish candle. Also, explain its anatomy. (Original screenshot required)
BULLISH JAPANESE CANDLESTICK
Bullish Japanese candlestick is a candle stick that can be seen in the uptrend crypto market. The candlestick appears in green or sometimes blue color. The candlestick starts with an aspect which is the low open part, and it then goes up to end with a high close part. In a bullish candlestick, we have it to end with the end and been above the open area.
A bullish candle always closes higher above the previous candle which signifies a rise in price, which simply means that, demand is more than supply and buyers are in control.
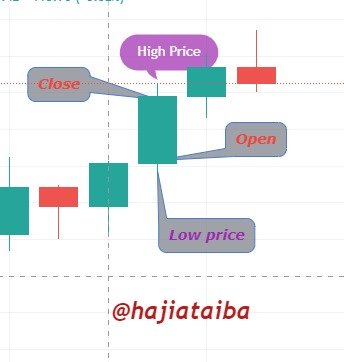
Lets look at the areas of the Bullish Candle Stick
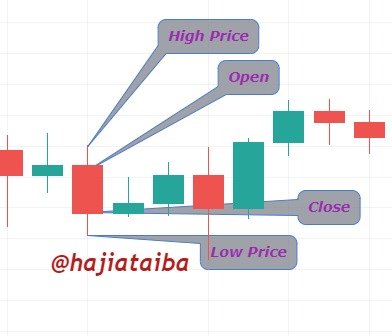
OPEN
This is where the candle start. It is also known as the opening price and It shows the beginning of the price movement, and a bullish candlestick always opens lower.
Close
This aspect marks the end part of the candlestick after a some period of time. This can also be called the closing price. A bullish candlestick is all the time closes higher than it opened because of buying pressure.
Low price
Low price is the low aspect of the candle price. This indicates the lowest point of the price of the crypto asset. This does not shows it's own of the price trend of the candlestick.
HIGH PRICE
High price is the highest of the candle price. This aspect shows the top or highest price of the crypto asset. This aspect does not stand on its own of the price trend of the candlestick. Moreover, This is also the top or the highest point in which the price of the crypto asset has reached in a period of time.
BEARISH JAPANESE CANDLESTICK
The candle stick chart fundamentally shows market activities between buyers and sellers. And also, it shows the reflection of investors emotion in the market. Moreover, It also shows different prices at different intervals and also, the overall trajectory of the marketing general. The candlestick comprise of high,open, close and low.
High
This candle stick shows the highest price of a crypto asset that is recorded on the candle stick on a particular time. And this is the highest aspect of the candlestick. The candlestick is of its own.
OPEN
This is the starting point of the candlestick. And this so also known as the opening price. This shows the starting price of movement and how the bearish candlestick opens. This is can be found at the top of the candlestick and it is simply known as the opening price of it.
LOW
This is the lowest price record on a particular time period or of a candlestick. This is the low price we’re a crypto asset reached with a period of time. This aspect own it’s candlestick. And also, the low can be below the close or at same time as the close. In simple terms, when low is below the close, it simply means that, price is opened.
CLOSE
This is the ending or the closing aspect of a bearish. This marks the ending part of the candlestick after a period of time. This is found as the ending aspect of the candlestick. This is the ending or the closing price of the candlestick.
CONCLUSION
In simply teams, the Japanese candlestick it really has a great impact in the crypto market and since the Japanese candlestick came into the Crypto world, it has brought a great benefits to buyers and sellers. Also, The Japanese candlestick also tell us the trend of the price of the crypto asset, which help us to make decisions. It also communicated to us (traders ), as to when we should enter the market for a particular asset so that we can make profit rather then loss.
I will like to use this opportunity to thank the professor @reminiscence01 for his wonderful lecture this week. I really learned a lot from his lesson and I hope my homework task will be reviewed thank you!!!!
All screenshots where taking from