[Technical Indicators] - Crypto Academy / S4W2 - Homework Post for @reminiscence01

In your own words, explain Technical indicators and why it is a good technical analysis tool.
Technical Indicator, simply refers to the usage of previous market movement, inorder to determine/predict future price movement of an Asset (forex, commodities, stock, Cryptocurrencies, etc). The past price movements are recorded, and a mathematical formula is then used to calculate/predict the future movement in price of an asset. This information is presented graphically, and it is used by traders to make trading decisions. For example, a 20 period moving average, will consider price movement for the past 20 periods, and then find its mean, so as to predict price movement. A trader is now able to use the 20 period moving average to identify market trend, and when it is accompanied by another indicator such as the Relative strength Index, it can help traders trade with more confidence.
Indicators are amongst the tools used by traders for technical analysis. Infact, it is integral to technical analysis. But just as I explained the logic and the mathematics behind the 20 period moving average above, it is important for traders to also understand the various indicators so that they can be configured and used appropriately. A trader should also never use a single indicator to make trading decisions. It is always good to use more indicators, so as to be certain before executing a trade. Traders should also note that no trading system is 100% effective.
The following reasons, explain why technical Indicators is a good tool for technical analysis.
• It can be used for prediction: Already, we have seen that predictions from technical indicators are reliable to a certain degree because they take into account past data, and uses a mathematical formula for prediction. It uses the past to predict the future which is very important.
•A combination of 2 or more technical indicators which have been configured correctly, can also be used in technical analysis to find trade signals. However, to make more reliable, a trader should accompany the indicators with other trading tools.

Are technical indicators good for cryptocurrency analysis? Explain your answer.
My answer to this question is yes. I have on many occasions used these indicators to trade cryptocurrency. As I earlier mentioned, these indicators uses past data to predict future price movement, and these makes it reliable to a certain degree.
Cryptocurrency traders can also use technical indicators to find trade signals, but always remember that it is best for the signal to be confirmed using 2 or more indicators before actually taking a trade.
Cryptocurrency traders can also use indicators like the moving averages indicator to identify market trend, as well as trend reversals. These indicators can also be used by traders to trade areas of support and resistance, identifying possible entry positions, stop loss positions and take profit positions. I would recommend every cryptocurrency trader to incorporate technical Indicators into their trading system.
Illustrate how to add indicators on the chart and also how to configure them. (Screenshot needed).
Inorder to add indicators to a chart, we do the following.
• Visit the site tradingview.com
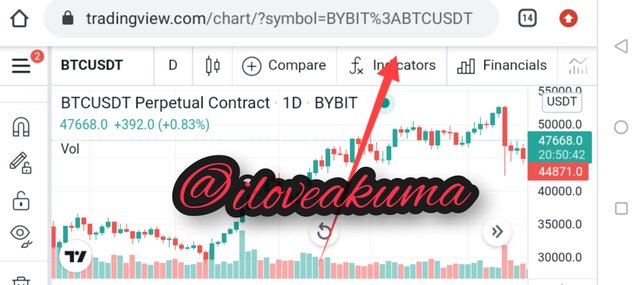
• Once it loads up, you search the pair of cryptocurrency you want to trade. I'll be using the BTC/USDT pair.
• Once the chat loads up, to add an indicator, click on the button labelled "fx indicators"
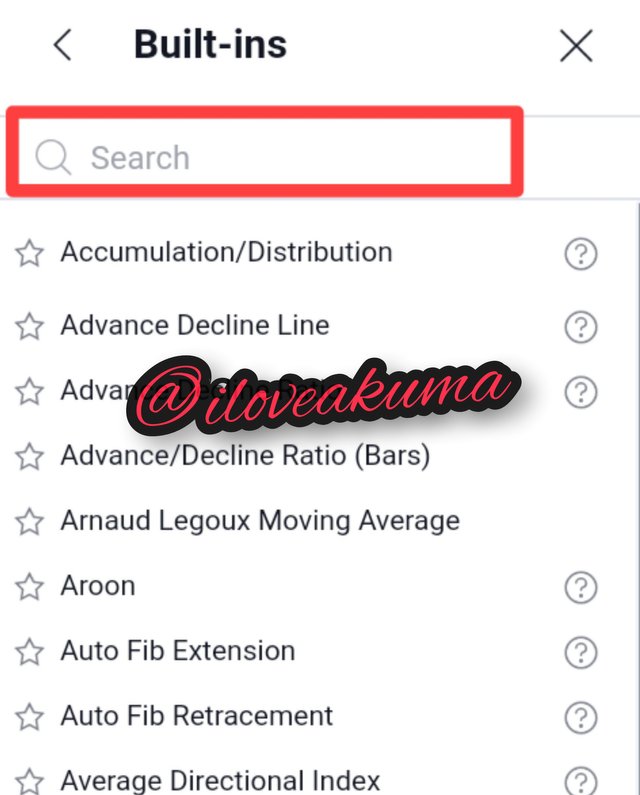
• A list of indicators will then appear, proceed to search the indicator you desire to add using the search bar. Once you search for it, simply click on it to add it.
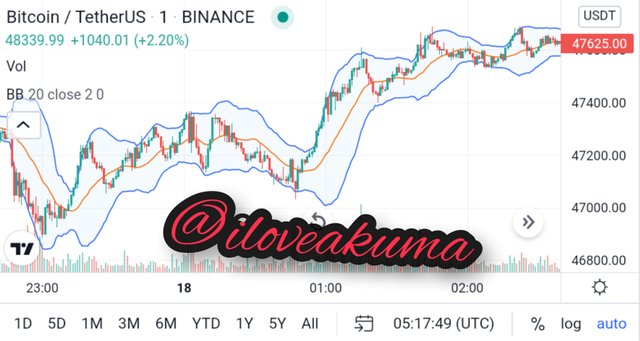
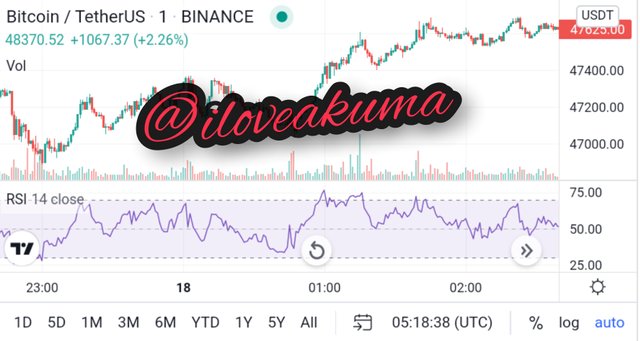
• I successfully added the Relative Strength Index, Bollinger and the moving averages indicators to my BTC/USDT chart
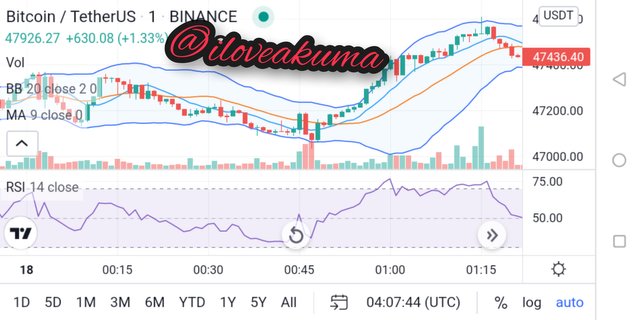
All screenshots above are from tradingview.com
To configure an indicator, do the following:
• You click in the indicator name on your chart, and menu will pop up.
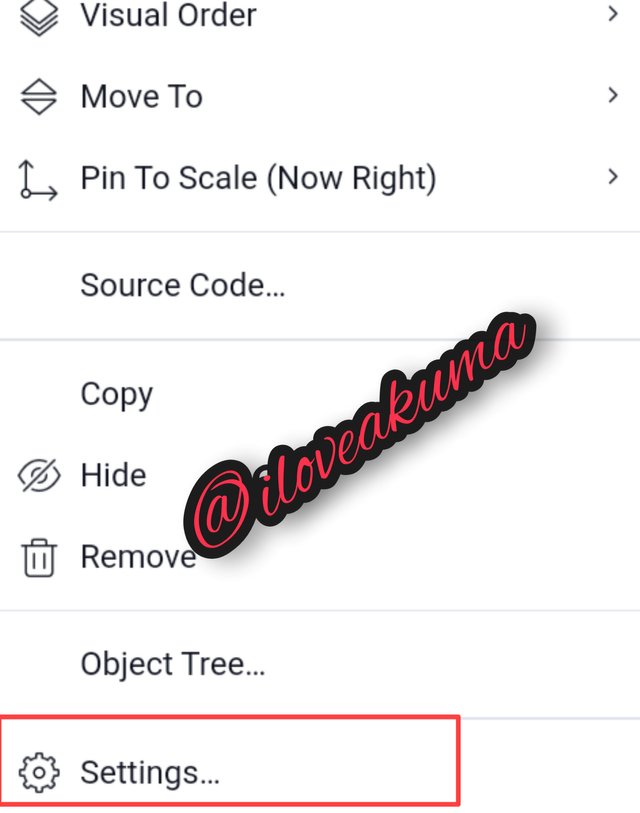
• From the menu, click on settings. The menu will appear showing the various settings. A trader can now configure the indicator to fit their trading strategy. A trader can now configure input, style and visibility settings.
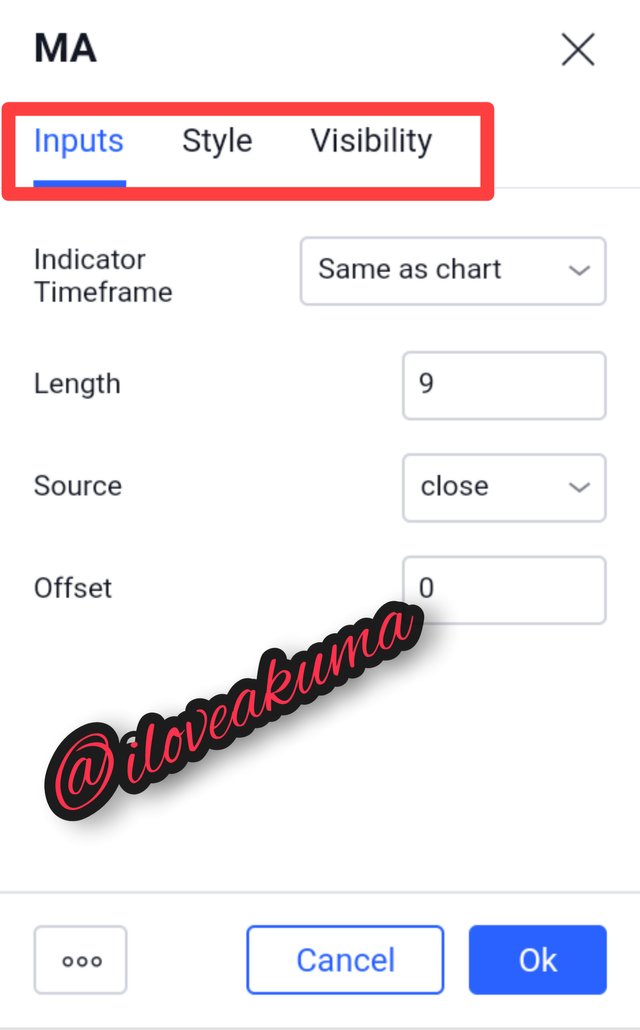
All screenshots above from tradingview
Explain the different categories of Technical indicators and give an example of each category. Also, show the indicators used as an example on your chart. (Screenshot needed).
The different categories of technical indicators include the following;
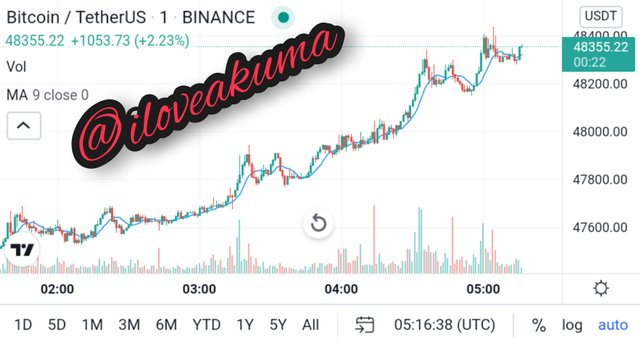
• Trend based indicators: Just like the name implies, trend base indicators aid traders in determining the market trend(direction of price). That is, whether price is moving upwards or downwards. Traders can also use trend based indicators to determine if a trend is weak or strong, thereby helping them to trade. Examples of trend based indicators include; The Ichimoku Kinko Hyo, and Moving average indicators. These indicators always tend to move in the same direction with the market trend.
•Volatility Based Indicators: Indicators under this category, are used to identify the price volatility of an asset. Volatility in price refers to price fluctuations. Prices of assets are not stable. They rise and fall. Volatility indicators such as the Bollinger Bands and the Average True Range(ATR) can help us trade these price fluctuations. When price gets too high, a trader should be looking forward to selling, and vice versa.
• Momentum Based Indicators: They are also known as Oscillators. They identify the momentum/strength of a market by using overbought and oversold zones. Overbought usually mean that the price of an asset has risen too high and a trader should be looking forward to sell, meanwhile oversold usually mean that price has fallen too low, and traders should look forward to buying. Example of this indicator include; The relative strength Index (RSI) as well as Stochastic Oscillator.
Briefly explain the reason why indicators are not advisable to be used as a standalone tool for technical analysis.
It is never advisable to use indicators as a standalone tool for technical analysis. Trading Cryptocurrencies is very risky, so it will be very irresponsible to use just indicators in making trading decisions. Indicators often generate false signals which can lead to the loss of money. It is more advisable to use many indicators yo actually confirm a signal, so that a trader can trade with confidence. Personally, I think that indicators should just be one of the tools in a trader's arsenal. Accompanying indicators with other tools such as chart patterns, candlestick patterns, etc, will yield better results for a trader.
Explain how an investor can increase the success rate of a technical indicator signal.
First of all, the investor must have basic knowledge about the indicators he/she wishes to use. Knowledge such as knowing which asset the indicator works best with, knowing the timeframe in which it performs best. An investor must also be able to configure the indicator appropriately so as to have the best results. I also think that indicators should be accompanied by other technical analysis tools. This will reduce the risk of false signals, thereby reducing the amount of losses for the investor.
CONCLUSION
If there's one thing I learned in this lesson, it is that technical indicators are never to be used as a stand alone tool. Always accompany them alongside other tools for a more profitable trading experience.
Thanks for reading...
Hello @iloveakuma, I’m glad you participated in the 2nd week Season 4 of the Beginner’s class at the Steemit Crypto Academy. Your grades in this task are as follows:
Observations:
That's correct. it is important to use more than 1 technical analysis tool when trading.
Recommendation / Feedback:
Thank you for completing your homework task.