Steemians Talk Survey Series: Results - Anarchists Are More Successful

Anarchists are more successful, @berniesanders v. @dollarvigilante, and uncertainty around @dantheman's negative voting proposal: The results are in!
While some of the results from my most recent survey were unsurprising (i.e. those who earn less are less satisfied), there were some very interesting findings that have some implications for users' success on the platform. These findings can be acted upon immediately and used to improve earnings and user experience. All findings are presented below and illustrated by scatter plots.
Methodology Lessons
One of the biggest takeaways has been for methodology in future surveys. In analyzing the results, I found that some answers just could not be quantified and used correctly. These survey questions wasted respondents' time and did not contribute to the finished product. Going forward I have a better perspective on useful data and the best methods of collecting it.
It is also apparent that there needs to be better incentivization to respond to the surveys. This is evidenced by the fact that the original post announcing the survey received 48 upvotes, while the actual survey only received 31 responses.
Number of Posts = Success
Among respondents, the results show a strong correlation between the number of posts and success on the platform.
Articles and Earning/Voting Satisfaction
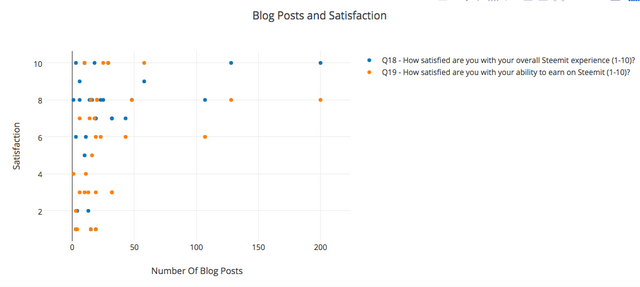
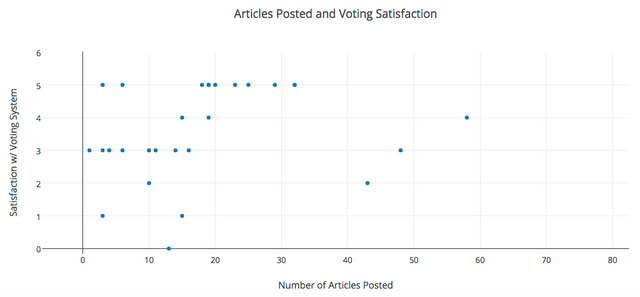
Reputation is an easy way to quantify a user's success, but I feel that a user's satisfaction is a better metric for their success. A user with a higher reputation that is not satisfied has not truly succeeded and poses a greater chance of causing damage to the platform as a whole. As you can see here, the number of articles posted also correlates to satisfaction with the platform, earning ability and voting system.
Comments and Replies
In addition to blogs posted, my findings show that the number of "Total Posts" are also a reliable predictor of success.
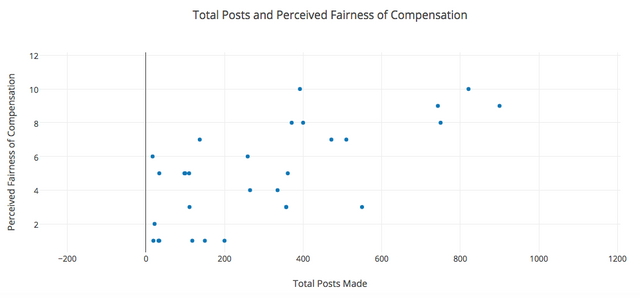
Here we see that users with a higher number of total posts feel that they have been compensated fairly for their work.
Whale Approval
An interesting finding regarding total posts is that it is not always a predictor of approval of whale activity.
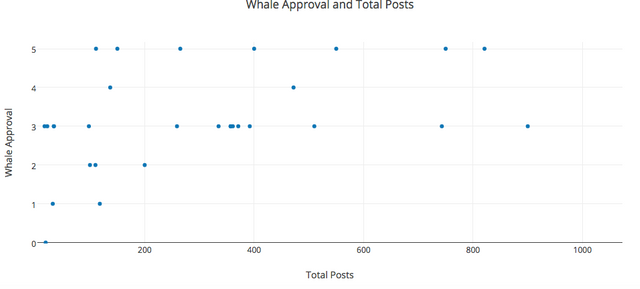
While the chart sees an uptick in whale approval between 0 and 350 total posts, it is fairly unpredictable beyond that point. I hope in future surveys to dig into this phenomenon further.
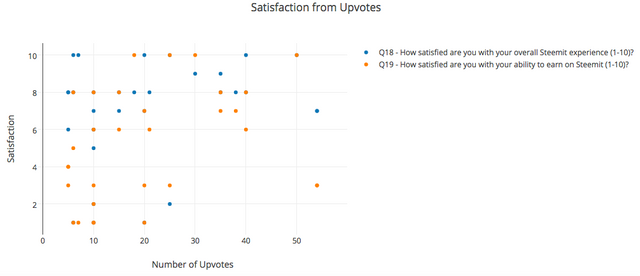
Upvotes = Happiness
The number of upvotes also turned out to be a reliable indicator of satisfaction with the platform and earning ability. This is another factor that bears further investigation. My assumption is that this satisfaction is largely driven by curation rewards.
Reputation Does Not Equal Satisfaction
Based on my findings, I do not believe reputation to be a good indicator of satisfaction. My hypothesis is that this is because it is not an indicator of engagement. While most high-reputation users have more blog posts, this is not always the case.
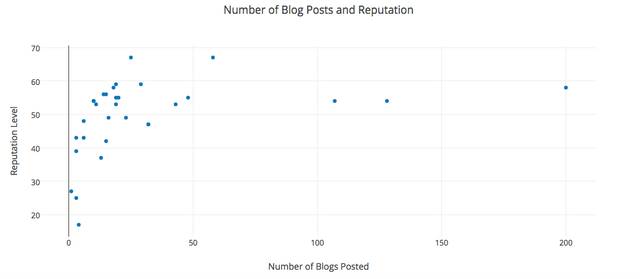
My results found that those with more articles published, have higher reputations, especially as the users approached 50 and exceeded 50 posts; however, as you can see, with the exception of 7-8 outliers the curve is pretty steep and not as good an indicator as other metrics.
Confidence in STEEM
A more frightening finding is that reputation is not an indicator of confidence in the currency.
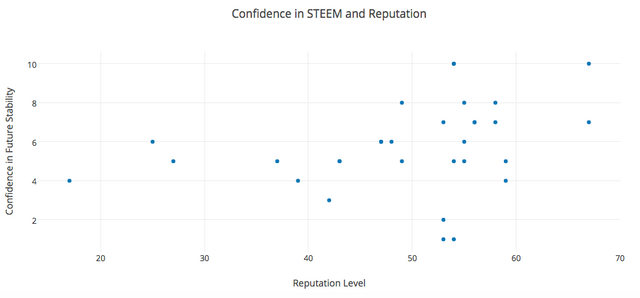
As you can see, once the reputation level gets closer to 50, we start to see higher levels of confidence; however, for the most part, they stay relatively stable around a 6.
Voting System Satisfaction
Additionally, reputation is not a reliable indicator of satisfaction with the current voting system.
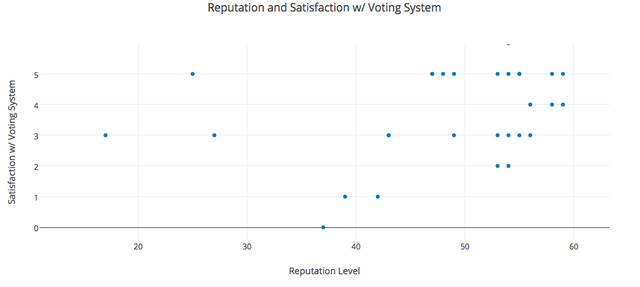
More responses may bring some better insight to this subject, but it appears that satisfaction is relatively constant across the board. The good news is that satisfaction appears to be fairly positive.
@Dantheman Approval Ratings
Recently, @dantheman suggested that negative voting be instituted to address some of the concerns with our current system being unbalanced. This would allow users to vote against other users' votes, thereby negating a vote that the user feels is unbalanced without flagging the actual post.
Reputation and Approval for Negative Voting
While users with a reputation level over 40 had more favorable views of the proposal, there is still an overwhelming majority that is neutral or disagrees with it.
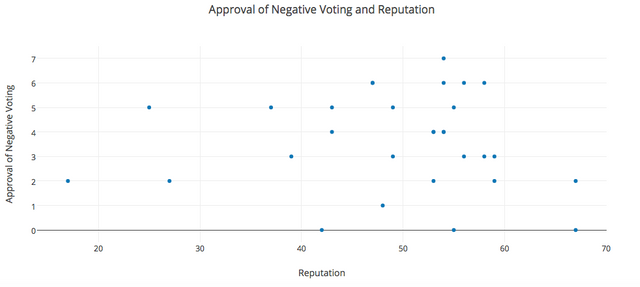
In addition, you can see that the users at the highest end of the spectrum are among the least favorable to the proposal.
Earning Satisfaction
Earning satisfaction is also not a reliable indicator of approval, and the chart becomes even more muddled than the above.
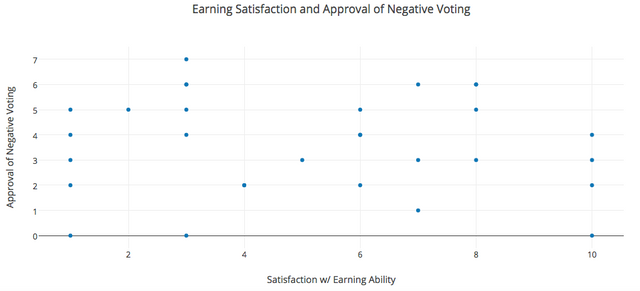
It seems that while there may be some desire to change the current voting system (though my findings suggest these users are not in the majority), @dantheman's proposal was not exactly what users had in mind.
@Dollarvigilante v. @Berniesanders
In the case of @dollarvigilante and @berniesanders, I was interested to see where the different Steemit demographics stood. While it should be noted that the majority of respondents did not know/care about the issue, two correlations stood out to me.
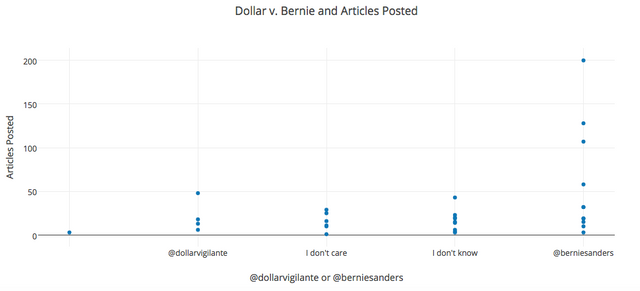
Articles Posted
While not incredibly predictive of where users fall, it is interesting to note that users with more than 50 blog posts overwhelmingly favored @berniesanders.
Reputation
Also not predictive, but interesting to note is the heavier concentration of high reputation users that favor @berniesanders.
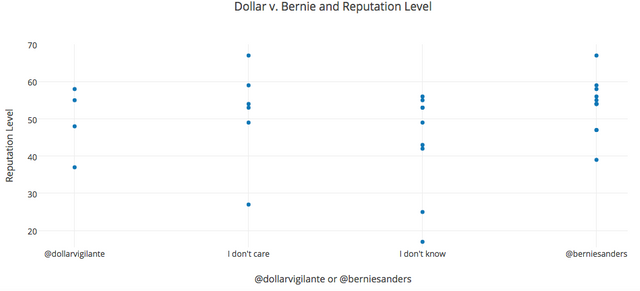
These factors suggest to me that many of the supporters of @dollarvigilante may be casual readers that have been recruited to the platform from his other media sources, while those of @berniesanders have more history and engagement with the Steemit platform.
Political and Continental Factors
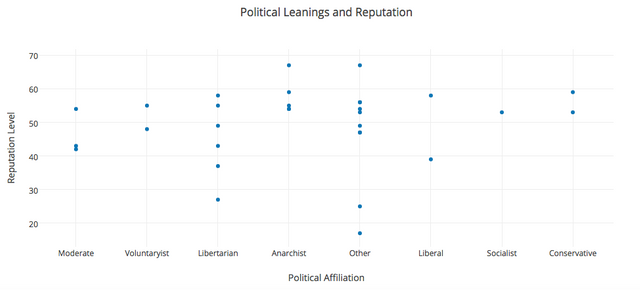
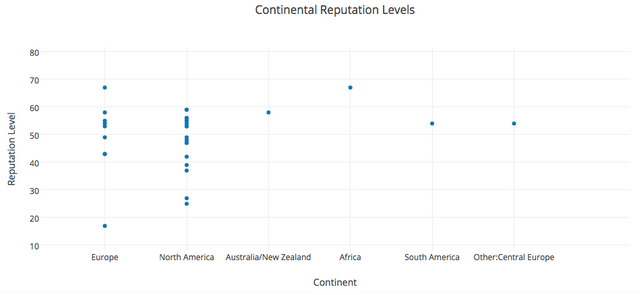
The last couple of tidbits I will go over are on the fun side. I thought it would be interesting to compare the reputation levels of different nationalities and political leanings.
Anarchists are More Successful
While libertarians appear to have more representation, and the unquantifiable "others" are in the majority, the anarchists are more heavily concentrated at the top.
The Revolutionary War
Not quite, but it made a good subheading! As I'm sure we all suspected, the majority of users are concentrated in Europe and North America. The Europeans are more heavily concentrated in the higher reputation levels, with the North Americans more diversified, but still having representation at the top. It appears to be relatively even, with the Europeans having a slight edge.
Conclusion
Articles posted, comments/replies, and upvotes are overwhelmingly the greatest indicators of success and satisfaction on the platform. They are also the most reliable indicators of user engagement (which is unsurprising). There is a potential argument for correlation v. causality. You might say that user engagement is driven by success and not vice versa. In my humble opinion, the survey accounts for this by using responses from less-successful members that still interface with the platform regularly (no respondents indicated that they log in to the platform less than once/day). Based on these findings, I would urge users that are looking for more success to continue posting and stay engaged. All of the evidence points to positive rewards for persistence!
I am looking forward to hearing your thoughts on this series and ideas for the next survey! I am working to put it together now and will release it for responses within the next week or so.
To make sure you don't miss the next survey, follow me: @jaredcwillis!
shoutout to me for being the one socialist lmao
Go figure... marketplace of ideas and its crickets from the socialists :D
you can be socialist and anarchist and most socialists would take anarchy over socialism
I'd love to see the date users first joined/posted incorporated into the data. Although this can be inferred to some degree, I suspect that the relatively larger payouts early on may have a very large impact on which users hold which opinions.
I planned on incorporating that but made an error in my methodology. I asked responders to select from different ranges of time on the platform, which I discovered later is not very usable when charting results. In my next survey I will do it differently!
nice analysis and presentation @jaredcwillis, thanks for sharing :)
DATA-GASM!
Keep this up! Where are you gathering your input?
Thanks for the support! I distributed a survey in a post about a week ago and also solicited steemit.chat users for responses.