An Introduction to Advanced Decline Line In Trading
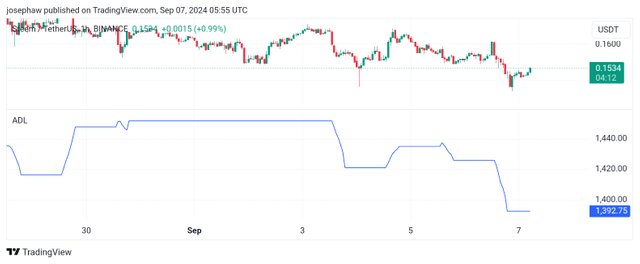
Here we are again today friends to learn about ADL which is an abbreviation of Advance Decline Line. It is a technical indicator that helps you to plot the difference between the number of assets (stocks, currency) that are advancing to the declining assets (stocks, currency) daily.
Advance Decline Line

Tradingview
The ADL is best known in the stock market than in the crypto market, which in the stock market is known as the breadth indicator that is mostly used by traders to assess the overall weakness or strength of a given currency. As we have said earlier, it is all about showing you the difference between the number of advancing stocks (assets) and declining stocks (assets).
In a simple sentence, the ADL is an indicator that helps traders, and investors in the financial markets, to understand whether more stocks (assets) are advancing in the market or declining in the market daily and the cumulative effect of the movements of the stocks (assets) over time.
Components
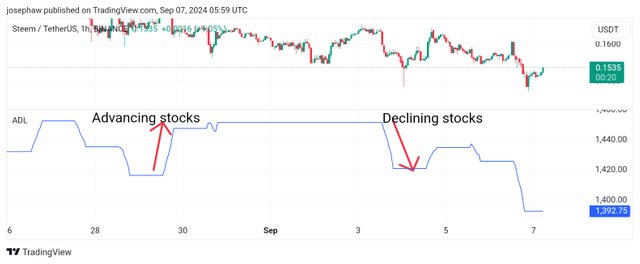
Tg key components of the advance-decline line are advancing stocks and declining stocks.

Tradingview
Advancing stocks:
This is the number of stocks that have increased in price of the stock during trading hours.
Declining stocks: This is the number of stocks that have decreased in price of the stocks in a given period which is usually daily.
Interpretation

Tradingview
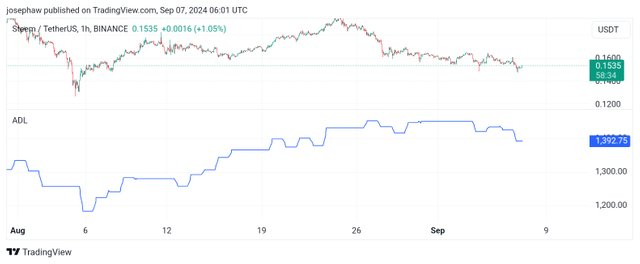
Upward Trend: During an uptrend you will see the ADL trending upward, which is a suggestion that a large number of stocks are participating in the rally (market), indicating market strength.
Downward Trend: This is the opposite of the upward trend, in which you will see the ADL signals that a large number of stocks are declining rather than advancing, which is an indication of the weakness of the market.
Divergence: This is when the ADL moves in the opposite direction of a major market index, which can signal a potential market reversal. In a situation where you see that the index is rising but the ADL is falling, it means that fewer stocks are supporting the market, which may lead the market to a downward movement.
Calculation
The given formula is used to calculate the ADL indicator.
Advance decline line = Advancing stocks - Declining stocks + Previous Net Advance
We have the daily calculation which is calculated by misusing the advance stocks from the decline stocks. Let's consider looking at the given example below.
Let's say as an investor you are looking for a way to create an ADL for an index for over four days and you are been given the following data as shown below.
| ADL | DAY 1 | DAY 2 | DAY 3 | DAY 4 |
|---|---|---|---|---|
| Advancing stocks | 70 | 60 | 56 | 40 |
| Declining stocks | 30 | 40 | 40 | 60 |
| Total Stocks | 100 | 100 | 100 | 100 |
Based on the information above, the calculation will be as shown below.
ADL Day 1 = 70 – 30 + 0 = 40
ADL Day 2 = 60 – 40 + 40 = 60
ADL Day 3 = 56 – 44 + 60 = 72
ADL Day 4 = 40 – 60 + 72 = 92
Disclaimer
We have learned about the ADL which you can use in combination with another indicator if you want to have more view of whatever market that you want to know. Note that this is not investment advice but everything that is said here is for educational purposes.
Thank you, friend!


I'm @steem.history, who is steem witness.
Thank you for witnessvoting for me.
please click it!
(Go to https://steemit.com/~witnesses and type fbslo at the bottom of the page)
The weight is reduced because of the lack of Voting Power. If you vote for me as a witness, you can get my little vote.
https://x.com/AkwajiAfen/status/1832298662614999335
Note:- ✅
Regards,
@theentertainer