Steemit Crypto Academy | Summary On Homework Task Week5-Season5

December 18, 2021 was the deadline for Week 5 of Season 5 to accept your homework, I want to thank the 46 students who tried and worked hard this week submitting their essays to complete the assignment and get the best grades.
This week we introduced the Linear Regression Indicator which is a trend following indicator that plots a dynamic version of the Linear Regression Indicator as a moving average.
Linear regression can be used as an alternate form of moving average because they are conceptually very close.
The concept of this type of indicator helps to provide assistance to traders who wish to identify the direction of the trend, its magnitude and the speed at which it is moving.
This indicator can also help a trader identify trend reversals by using the crosses of two linear regression lines.
As always, one should never use an indicator alone to make trading decisions.
Linear regression should be used as part of a larger system that includes other metrics, to help you make better decisions.
I hope all users who have researched this week will benefit from the set of information and analysis provided to determine how much of an asset that typically moves in a given time period to set profit goals and decide whether or not to try to negotiate.
We always affirm that the main goal of our Steemit Crypto Academy community is to ensure knowledge and promote quality, fair and inclusive learning opportunities in the field of cryptocurrency for all.
Then I asked the students a few questions to gauge how well they understood the topic and to assess the cognitive gains they had made from reading the lesson.
The questions to be answered are:
1. Discuss your understanding of the principle of linear regression and its use as a trading indicator and show how it is calculated?
2. Show how to add the indicator to the graph, How to configure the linear regression indicator and is it advisable to change its default settings? (Screenshot required)
3. How does this indicator allow us to highlight the direction of a trend and identify any signs of a change in the trend itself? (Screenshot required)
4. Based on the use of price crossing strategy with the indicator, how can one predict whether the trend will be bullish or bearish (screenshot required)
5. Explain how the moving average indicator helps strengthen the signals determined by the linear regression indicator. (screenshot required)
6. Do you see the effectiveness of using the linear regression indicator in the style of CFD trading? Show the main differences between this indicator and the TSF indicator (screenshot required)
7. List the advantages and disadvantages of the linear regression indicator:
8. Conclusion:

Discuss your understanding of the principle of linear regression and its use as a trading indicator and show how it is calculated?
The linear regression indicator is used for identifying and tracking trends, much like moving averages.
The indicator should not be confused with Linear Regression Lines which are straight lines fitted to a data series of points, or with the Linear Regression Slope indicator which looks like an oscillator.
The linear regression indicator plots the end points of a series of linear regression lines drawn on consecutive days.
The formula uses the sum of least squares method to find a straight line that best matches the data for the selected time period.
The end point of the line is drawn and the process is repeated on each subsequent day.
How does this indicator allow us to highlight the direction of a trend and identify any signs of a change in the trend itself?
The most common use of Linear Regression is to go buy or sell in the direction of Linear Regression, as shown in the graph below.
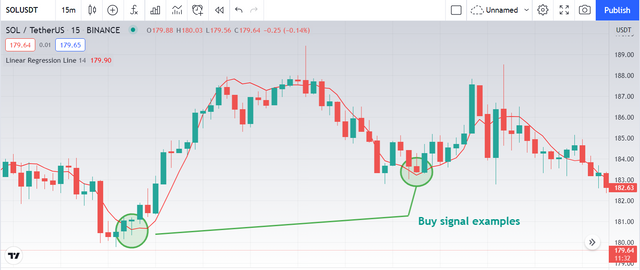
However, in order to avoid bad signals, it is advisable to use an oscillator type technical indicator. Indeed, it is advisable to use the direction of the linear regression indicator to enter and exit the market in addition to a longer term indicator as a filter.
Based on the use of price crossing strategy with the indicator, how can one predict whether the trend will be bullish or bearish (screenshot required)
A variation of this technique is to enter a long position when the price cut or crosses upward the linear regression indicator, and exits the position when the linear regression indicator falls.
Conversely, we enter a short position (short sale) when the price cut or crosses downwards the linear regression indicator, and buy back the position when the linear regression indicator rises.
This indicator can also be used to identify trend reversals using the crosses of two linear regression lines.
Explain how the moving average indicator helps strengthen the signals determined by the linear regression indicator. (screenshot required)
From a technical point of view, linear regression exploits the process better defined as “ least squares”To adapt the fee to the data as effectively as possible, however what matters now are the practical repercussions that the fee has on trading. Linear regression is sometimes confused with the moving average but practical experience suggests that these are two different types of indicators that make different measurements.
The moving average is a lagging method: unless the price movement shows very low volatility for most of the duration of the moving average, it will likely be above or below the moving average line. This is not the case with linear regression: as soon as the price trend begins to change direction, the linear regression line more closely embraces the price candles. This explains why linear regression is used for different purposes than the moving average. In fact, it should be emphasized that the linear regression line does not represent an average, but rather an efficient path, not being burdened by past values.
For example, if the time interval is moved forward by a period, then the oldest data is deleted and the new one added, which applies to both the moving average and the linear regression. The difference is that in the latter case, the entire line is recalculated. Everything changes, therefore, while in the case of the moving average it is only the most recent point that takes on a new value.

The fifth week of the fifth season, which took place from December 11 to December 18, 2021, witnessed a slight decrease in entries compared to the third season, but this does not prevent the confirmation of the success of this week and its passage in the best conditions as usual.
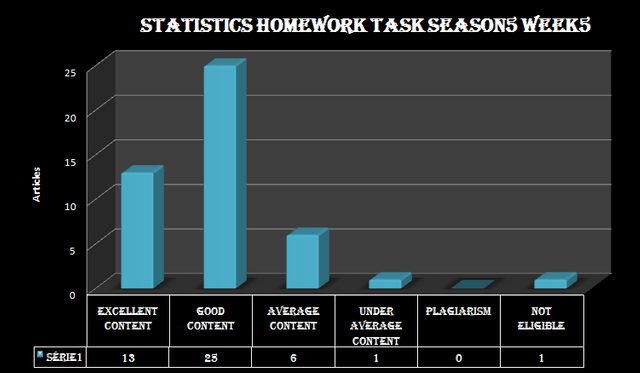
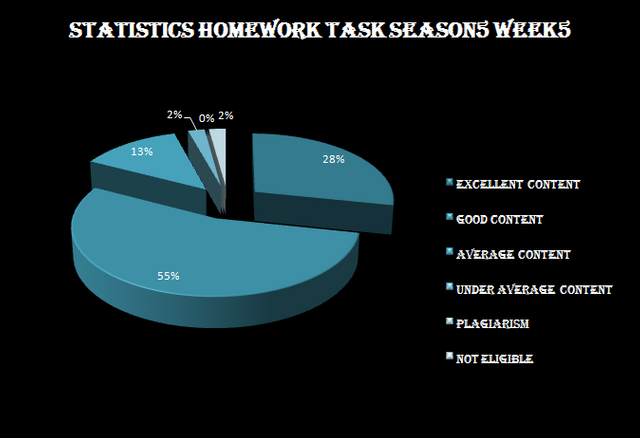
We note an increase in the percentage of articles with excellent content, reaching 28% of the total writing, an increase of 11% compared to the previous week,
With a high percentage of articles with good content as usual at 55%, although it is down by as little as 4%,
Articles with medium content saw their percentage stable, rated at 13%.
Thus, the percentage of successful homework with a positive overall vote is over 96% versus 2% who failed to get a grade above average, and if that is anything to be said, the earnestness with which students get what they are asked and how well Their eagerness to learn and do their best to get the highest grades and best results.
We also see 0% of plagiarism posts which we are looking to combat and it remains our great hope that students will continue to write articles without these practices which remain the number one and most dangerous enemy towards improving their level and developing their knowledge.
2% were placed out of competition due to non-compliance with the conditions of participation, and it must be remembered that the conditions of participation require a reputation of 65 and 900SP regarding expiration time and fulfillment of conditions for participation in the #club5050 event, so we invite participants to adhere to it. Conditions so that no preparation effort is wasted without obtaining evaluation and reward.

We would like to first thank all the participants for their challenges and inspiring achievements, and we hope that the spirit of this competition will continue for as long as possible, and we hope that the culture of challenge and facing obstacles will spread in all communities.
We are pleased to announce the names of the three winners of the 5th week of the 5th season competition :


Cc:-
@steemitblog
@steemcurator01
@steemcurator02
Congratulations @kouba01
I have selected this as the

most positivepost amongst top 100 hot posts on steemit at this moment.Thanks for sharing your home work brother would you please tell me how can i start crypto academy from zero.
Really i want learn it.
Your article is well explained
You wrote like a professional writer
Keep it up
I want to ask something
Someone suggest me
Quantum leap
Crypto course
He said it's best course if you want to be successful in Crypto trading
Also giving digistore money back guarantee
Should I join this course?
Thank you very much, teacher for selecting my post!
The article is well written, keep us updated with initiatives. It brings more insight as I accumulate new gems on my trusted wallet application from https://atomicwallet.io/, in the long run.
Great