Monthly Analysis of Automated Posts
It's been a month since I first looked at the rising tide of automated posts. Their escalation had been rapid, rising to 5,000 posts per day and approaching 20% of overall post volumes. How have things changed in the intervening month? Time to take another look.
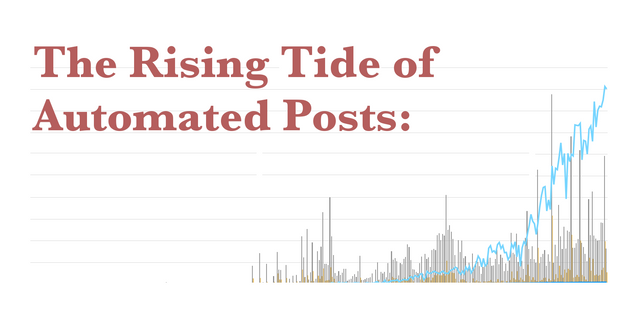
Here's where we left the story. This chart shows the number of articles and rewards from users that posted over 1000 times (articles not comments) in a 30 day period from October 25 to November 24. Our light blue "articles per day" line is heading off the chart!
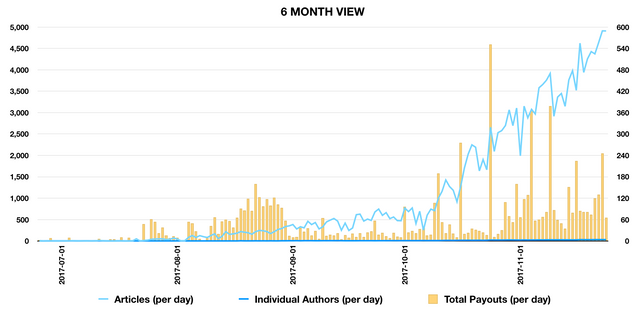
There were only 32 such accounts. Their headline statistics over the thirty day period were:
- 32 accounts, representing less than 0.1% of all accounts that posted.
- 107,956 posts, representing 17.5% of all articles posted.
- $3,341 in total rewards (author and curation added together) representing 0.3% of all rewards.
Here's the table of the top 20 accounts, showing the huge volumes in comparison to the small rewards:
| Ranking | Posts | Total Rewards |
|---|---|---|
| 20 | 2075 | 67.32 |
| 19 | 3093 | 92.65 |
| 18 | 3202 | 14.63 |
| 17 | 3310 | 65.48 |
| 16 | 3451 | 73.61 |
| 15 | 3716 | 155.63 |
| 14 | 3853 | 62.09 |
| 13 | 3924 | 101.01 |
| 12 | 3927 | 80.82 |
| 11 | 3931 | 92.13 |
| 10 | 4416 | 75.36 |
| 9 | 5229 | 73.02 |
| 8 | 5241 | 66.85 |
| 7 | 5770 | 72.2 |
| 6 | 6038 | 94.79 |
| 5 | 6164 | 118.79 |
| 4 | 6260 | 156.52 |
| 3 | 6382 | 78.99 |
| 2 | 6714 | 195.24 |
| 1 | 6757 | 1105.56 |
You can see the impact on these users on the right hand side of this distribution (number of posts per user over the 30 days along the x-axis, total posts generated on the y-axis).
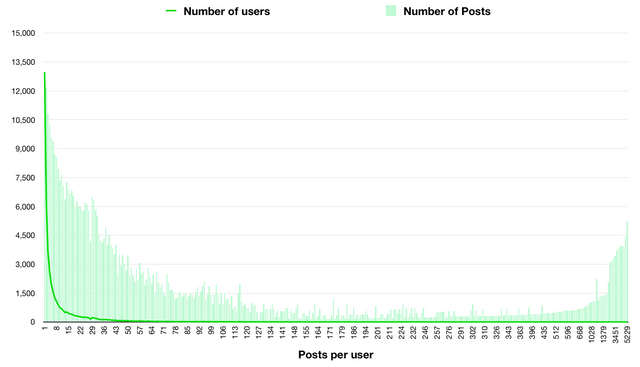
Lots of posts being generated by very few users causing a bump in the tail of the distribution.
If we catch up with these same 32 users again one month later we see an interesting phenomenon: An almost vertical drop off of production, down by 80%. It looks like Steem's teams of cleaners moved into action (a quick check of the @spaminator account shows a number of these users have been listed in the "Spam, Comment & Post Farming Reports" and downvoted).
Problem solved? Well, let's have a look. If I run the same analysis again, this time from November 25 to December 24 I get the following distribution.
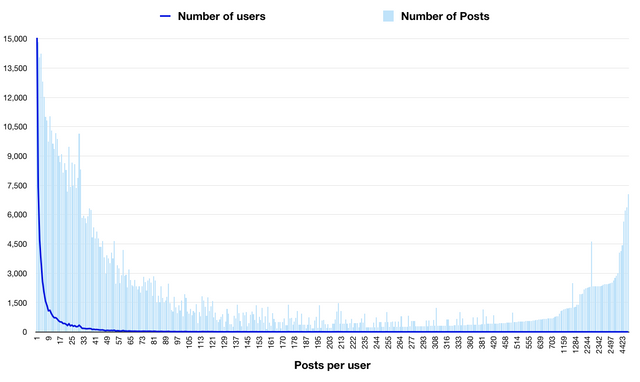
Our bump is still there!
Over the November - December window there were 49 accounts posting more than 1000 times. A rise of 17 users! Their headline statistics over the thirty day period were:
- 49 accounts, still representing less than 0.1% of all accounts that posted.
- 121,602 posts (a rise), representing 15.2% of all articles posted (a fall in percentage terms).
- $1,623 in total rewards (author and curation added together) representing less than 0.1% of all rewards (a significant fall).
Here's the table of the top 20 accounts for comparison to the above:
| Ranking | Posts | Total Rewards |
|---|---|---|
| 20 | 2343 | 0.81 |
| 19 | 2351 | 1.61 |
| 18 | 2419 | 10.25 |
| 17 | 2443 | 8.88 |
| 16 | 2444 | 16.87 |
| 15 | 2448 | 1.2 |
| 14 | 2476 | 4.57 |
| 13 | 2497 | 9.8 |
| 12 | 2514 | 15.29 |
| 11 | 2640 | 24.94 |
| 10 | 2758 | 21.06 |
| 9 | 2875 | 21.16 |
| 8 | 3006 | 49.52 |
| 7 | 4056 | 19.93 |
| 6 | 4138 | 635.15 |
| 5 | 4423 | 7.71 |
| 4 | 5645 | 17.13 |
| 3 | 6218 | 16.84 |
| 2 | 6380 | 57.44 |
| 1 | 7044 | 164.49 |
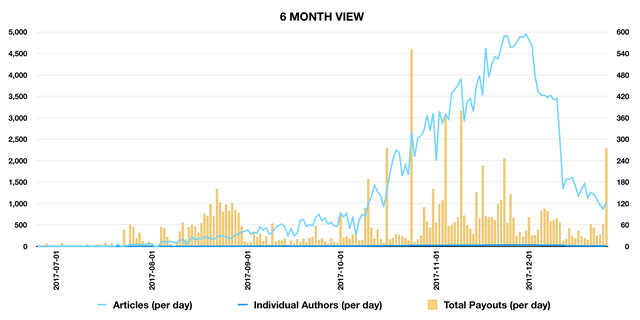
And here's the chart of article numbers and rewards from these 49 accounts:
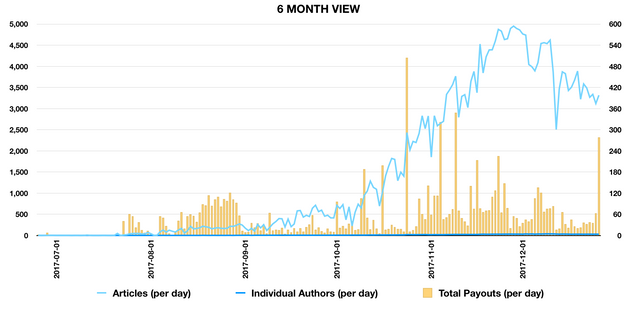
So we have some decline from peak spam, but much less marked than in our previous chart. So what has happened?
Well we can break down the 49 accounts into three types:
- Those accounts unaffected and broadly unchanged over the period (approximately 10 accounts).
- Those accounts that stopped posting in large volume around the 11th December (approximately 20 accounts).
- Those accounts that started posting in large volume around the 12th December (approximately 20 accounts).
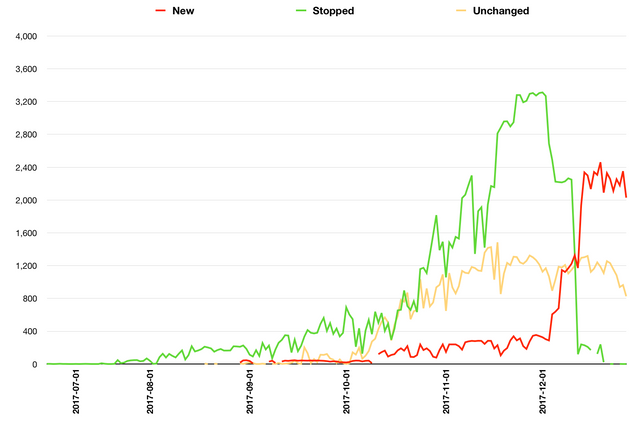
Conclusions
It's a slightly depressing chart in some ways but, with a little bit of licence to make assumptions, we can jump to two useful conclusions:
One: The actions of the steem cleaning teams do make a difference in stopping spam.
Two: Constant vigilance is required!
Questions
That's all for today.
If you have any questions or spot any errors please do not hesitate to leave a comment.
Methodology and Tools for Analysis
Tools
Raw data was obtained through sql queries of steemsql using Valentina Studio.
Data was analysed in LibreOffice and illustrated in Numbers (spreadsheet tools).
Data was obtained for various timescales, including a particular focus on October 25 to November 24 and comparison to November 25 to December 24.
SQL query
I used the following SQL query:
SELECT
    Comments.author,
    Count(Comments.author) AS [Posts],
    Count(distinct Comments.author) AS [DistinctCommentAuthor],
    count(Comments.parent_author) AS [ParentAuthor],
    count(distinct Comments.parent_author) AS [DistinctParentAuthor],
    sum(CONVERT(REAL,Comments.pending_payout_value)) AS [PendingPayoutValue],
    sum(CONVERT(REAL,Comments.curator_payout_value)) AS [CuratorPayoutValue],
    sum(CONVERT(REAL,Comments.total_payout_value)) AS [TotalPayoutValue]
FROM
    Comments (NOLOCK)
WHERE
    (YEAR(Comments.created) = 2017 AND MONTH(Comments.created) = 10 AND DAY(Comments.created) > 24 and depth = 0 ) OR
    (YEAR(Comments.created) = 2017 AND MONTH(Comments.created) = 11 AND DAY(Comments.created) < 25 and depth = 0)
GROUP BY
    Comments.author
Posted on Utopian.io - Rewarding Open Source Contributors
Thank you so much for the SQL query there. I'm doing this all in excel with power queries and I need to learn SQL I think to do this a bit faster.
Yes. They constantly create new accounts and some change their patterns.
I've changed my strategy and have a immediate flag for some when they post and a flag within the last 12 hours before payout. I'm separating my lists and adding to them now.
Hey @patrice!
Thanks for all the work you do on this. I appreciate it's a never-ending task and key if we're not all to drown in the tide of over-posting!
I'm self taught with SQL but I've got to grips pretty well with it now. If there are any particular queries you want designed I'd be happy to help out.
Also would it help to have something automated? Not automated flags but just something that lists up certain types of behaviour and refreshes every now and again for you to then investigate? e.g.
I think that this is something we could facilitate through utopian given the range of skills here, although only if it's useful obviously. Let me know what you think.
Great work here!
I hope @patrice gets back to you because I think you've already done much of the graft on the SQL side.
Thank you for the contribution. It has been approved.
You can contact us on Discord.
[utopian-moderator]
Hey @crokkon! Congrats on attaining your moderator role! Great to see another friendly analysis face on the team!
Hey, thanks! I'm not sure if it was a good idea to sell my precious time to first level user support - not all contributions are as easy to moderate as yours :)
Mate, great post and analysis. It is a little depressing that soo many post on steemt is automated and spam, but with the steem goldrush at the moment the incentive to act unethically is pretty high.
Im not a fan of restriction. But prehaps we have a soft cap on blog posts per day based on users reputation, and once they reach a certain rep the limit is removed. Just an idea.
Have a great day.
@strongerbeings
That's not a bad idea, a soft cap based on reputation. It would certainly slow new automated accounts from getting up to speed. The cap could be pretty high as well. 99.9% of users don't post anywhere near these volumes.
We're fortunate that the Steem blockchain can handle a really large volume of transactions. I think on other blockchains these volumes would be a much bigger issue. As steem reaches mass adoption this could potentially become a bigger problem so it might be wise to trial a few things while we have the capacity.
Holy cow - thanks for putting this together. Looks like it was a lot of work.
No worries!
It's the second time I've run this kind of study. It took a day or two the first time, but then I wanted to learn how to SQL so it was all part of that learning process.
This second run was supposed to be easier but ended up taking half a day, partly because it got interesting at the end and I had to do some manual work to produce that last chart. There's always something that pops up to investigate - the blockchain is a fascinating study into behaviour!
Wow-wa-weee-wa! Thanks for spreading your information. 👍
Keep up the vigilance MT , peace
Will do!
thanks for your analysis
You are welcome!
It's time to utilize the flags.
We're lucky to have a good set of people cleaning the blockchain. Delegating power to their teams may be a better approach than flagging - they will have built up plenty of experience in how to deal with this issue.
Good morning friend, I congratulate you for your brilliant publication, it is a great tool what is published, blessings for you and your family, A hug.
Thank you!
Hey kitty!
Hey @miniature-tiger I am @utopian-io. I have just upvoted you!
Achievements
Community-Driven Witness!
I am the first and only Steem Community-Driven Witness. Participate on Discord. Lets GROW TOGETHER!
Up-vote this comment to grow my power and help Open Source contributions like this one. Want to chat? Join me on Discord https://discord.gg/Pc8HG9x
Great post there, keep up good work !
This replay was created using STEEMER.NET Alpha ( support STEEMER.NET Transactor / Wallet / Exchange Project here: https://steemit.com/investors-group/@cryptomonitor/steemer-net-steem-blockchain-transactor-for-windows-android-app-funding-update-243-1200-sbd-28-12-2017 )
One for @steemcleaners / @spaminator. Massive automated spam of the same comment to all posts.