[TRADING STRATEGY WITH RSI + ICHIMOKU] || Crypto Academy S6W2 || Homework Post For Professor @abdu.navi03 || BY @msalmanjaved
Hello Everyone!
Greetings to All
I Hope everyone is doing well!
Today i am going to complete the Home Work Task of Season 6 Week 2, and task is Related to "TRADING STRATEGY WITH RSI + ICHIMOKU" given by the Professor @abdu.navi03 .


Question# 1
Put your understanding into words about the RSI+ichimoku strategy?

The RSI+ichimoku strategy means to combine the RSI and Ichimoku cloud indicator to understand the different aspects of the market. It is customary in crypto trading to combine a number of indicators so the buying and selling signals can be confirmed. By using this combination, we can pinpoint strong resistance and support levels, trend direction, volume and momentum along with overbought and oversold region.
The Ichimoku cloud is an excellent indicator that shows trend direction and momentum as well as support and resistance levels. It is a multiple moving average setup plotted in the form of 5 lines.
These five lines are a 9-period average, a 26-period average, an average 9 and 26 average, a 52-period average, and a lagging closing price line.
The two of these lines form a pattern called the cloud. The difference between the two lines is shaded either green or red. The color, direction and movement of this cloud can all be used in the speculative analysis.
When it comes to RSI it is a momentum-based indicator. It consists of a line that oscillates between two extremes. The important extremes are the 30 and 70. When the RSI line crosses the 30 line and approaches zero it means the market is entering an oversold sentiment. In addition to that when the line moves and crosses the 70 line the market is said to be entering the overbought region.

Question# 2
Explain the flaws of RSI and Ichimoku cloud when worked individually?

The flaws of the RSI and Ichimoku cloud when used alone forms the basis of the strategy of using them alone. It means when we used RSI alone it has some shortcomings that arises the need to use another indicator and same is the case with the Ichimoku cloud. As it is always said that no indicator can be 100% accurate therefore it is always suggested to use more than one indictor.
The Limitations of RSI
❌ RSI tells us about the relative strength of the trend and signifies overbought and over sold regions.
❌ It is not useful to be used inside a moving trend or when the trend has already been established.
❌ Though it may give an idea of support and resistance but you cannot solely rely on it for the accuracy and hence you need to pair it with some other indicator.
❌ It can also give false signals when used in short term trading styles.
The Limitations of Ichimoku cloud
❌ Overall Ichimoku cloud provide great market depth it gives a lot of information that RSI alone cannot give but its major fault when used individually is its complexity to understand in one glance and its lagging nature.
❌ Ichimoku cloud gives very late signals and thus if you a trader who looks for early entries it might not work great for you and hence you need to pair it with another indicator.

Question# 3
Explain trend identification by using this strategy (screenshots are required)?

RSI and Ichimoku cloud when used together can give a lot of information about the trend.
Bullish Trend
In case of the bullish trend, we look at the Ichimoku cloud and we see that the top of the cloud is going up and up. In addition to that the color of the Ichimoku cloud during a bullish trend turns green and it can be seen moving below the price.
Thus, during the bullish trend Ichimoku cloud acts as a support. Until the price keeps rejecting the Ichimoku cloud it keeps moving higher. When looked at the RSI it should be above the 50-line moving towards the overbought zone or in strong bullish trends RSI forms two tops near the overbought zone.
In the ADA/USDT chart below we see a bullish trend confirmed by the two indicators.

Bearish Trend
In case of the bearish trend, we look at the Ichimoku cloud and we see that the bottom of the cloud is going lower and lower. In addition to that the color of the Ichimoku cloud during a bearish trend turns red and it can be seen moving above the price.
Thus, during the bearish trend Ichimoku cloud acts as a resistance. Until the price keeps rejecting the Ichimoku cloud it keeps moving lower. When looked at the RSI it should be below the 50-line moving towards the oversold zone or in strong bearish trends RSI forms a bottom near the oversold zone.
In the ADA/USDT chart below we see a bearish trend confirmed by the two indicators.


Question# 4
Explain the usage of MA with this strategy and what lengths can be good regarding this strategy (screenshots required)?

Many traders go a step further and add MA along with the RSI and Ichimoku cloud. MA can be very excellent indicator when identifying breakout and identifying support and resistance levels. For example, in the ADA/USDT chart we see an addition of 100 period MA along with the two indicators.
MA lengths is particularly dependent on the type of trading styles of the traders. As indicated above the clod already has 9, 26, 52 MA one should and MA other than that such as that I have added an MA of 100 periods.

In this chart the MA line is acting as a support as the price is trading above it. The price rejects the AM to go above and continue the uptrend finally we see a breakout which is an indication of the trend reversal.

Question# 5
Explain support and resistancet with this strategy (screenshots required)?

The two indicators when used together can indicate accurate support and resistance levels. We first look at the Ichimoku cloud and then we look at the RSI for the confirmation or more accurately in a trending market Ichimoku cloud provides more accurate data for identifying support and resistance and in sideways market we often look to RSI.
In a trending market when the Ichimoku cloud is trading below the price and the price rejects it to go higher it is acting as a support. This support is often hard to break and if broken indicates a reversal. The distance of the price action and the cloud represents the strength of this zone. If the price action is further away then the support is strong.
When the Ichimoku cloud is trading above the price and the price rejects it to go back lower it is acting as a resistance. This resistance is often hard to break and if broken indicates a reversal. The distance of the price action and the cloud represents the strength of this zone. If the price action is further away than the resistance is strong.
The ADA/USDT chart shows how Ichimoku cloud behaves as the hesitance and support in trending market.

In a sideways market we look at the RSI whether it is near the overbought zone showing resistance or near the oversold zone showing support.


Question# 6
In your opinion, can this strategy be a good strategy for intraday traders?

According to me this strategy can work very well for intraday traders provided that the signals from both are taken into consideration while taking an entry.
With RSI you could only get an indication of the overbought and oversold signals and thus alone it may not be ideal for intraday traders.
When Ichimoku cloud alone is used it gives lagging signals which let traders miss important importunities.
When used together however early signals can be picked and important aspects of the markets can be analyzed. For example, a trader can see trend from the Ichimoku cloud.
He or she can then confirm the strength and the sentiment of the market using RSI. In this an accurate entry can be taken.
Ichimoku cloud can also be used locate the support, resistance areas and understand the movement of the market.

Question# 7
Open two demo trades, one of buying and another one of selling, by using this strategy?

Buying Trade
Ichimoku cloud can be seen to green. Initially it was red indicating the market was down trending as soon as it turned green and the price action showed a bullish candle, I see RSI for confirmation it was also moving above the 50 line. I set the stop loss near the previous low and executed the trade.

Sell Entry
For the sell entry I chose BTC/USDT and used MA 20 period along with the two indicators. The cloud was red and the price broke the MA. The RSI was also trading below the 50 line. I took the sell entry and has placed the stop loss near the previous high.


Conclusion
The combination of RSI and Ichimoku cloud can provide very good signals for the traders when used accurately. In this lecture we summarized these can be used to find support, resistance, overbought, oversold and momentum of the market to execute different trades.
I hope I would get some good remarks from professor on my effort.

Note : All screenshots are taken from tradingview.com all the Images that i have used have been citied and source have given with every image.
Cc :
Professor:
@abdu.navi03

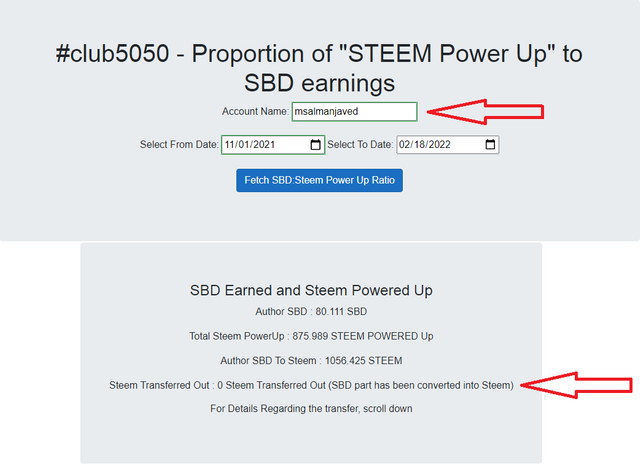
#club5050 Eligible

