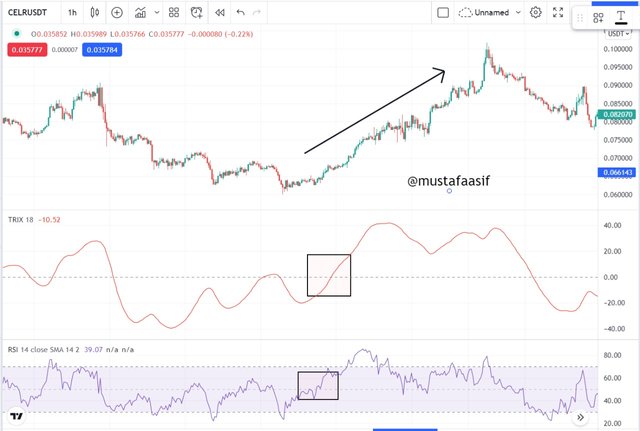
Crypto Trading Using Trix Indicator - Crypto Academy / S6W3-Homework Post for kouba01
Hello to all of SteemitCryptoAcademy's followers!
It gives me great joy to offer my homework for professor @kouba01, who is discussing Crypto Trading Using Trix Indicator. It was a really informative session, and I'd want to thank the teacher for that.


1.- Discuss in your own words Trix as a trading indicator and how it works.
The TRIX (Triple Exponential Moving Average) indicator is a valuable technical indicator tool for determining the velocity of a trading market for securities as well as identifying unstable market circumstances in a financial asset. or the underlying cryptocurrency
The Triple Exponential Moving Average (Trix) functions as both a velocity indication as well as a harmonic. It is used as a velocity indication, this can screen away unimportant price action (i.e. price spikes that are minor or irrelevant); being used as an oscillator, it displays the cheapest price zone and the probable maximum of the trading market for securities.
Some traders refer to the Trix indication as a "power indication," capable of signaling whether the market's momentum is falling or increasing, because everyone believes that this indicator can suggest such things. Because the TRIX is classified as an oscillation signal, it is related to the Comparative Vigor Index (RVI) and the Rolling Average Integration Signifier (MACD).
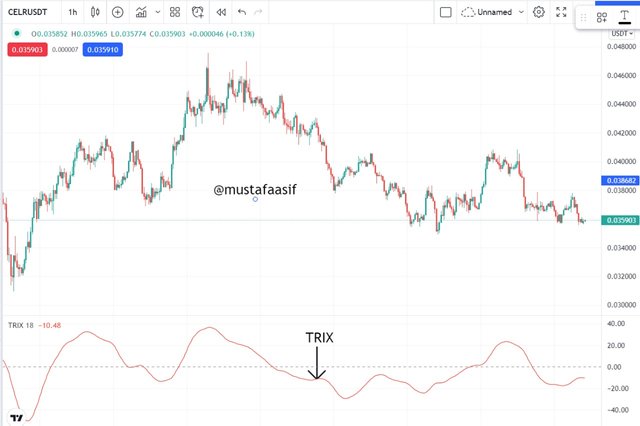
SOURCE
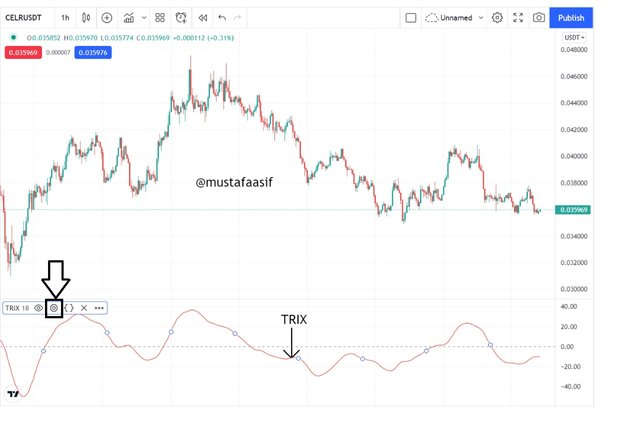
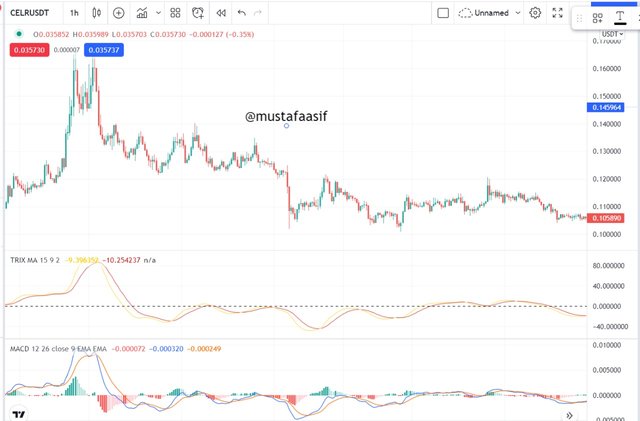
The chart above shows how the TRIX indicator appears when applied to the CELR/USDT chart.
The Trix indicator, as previously said, is comparable to exponential moving averages and may use this as an oscillation as well as a trend tracking indicator. TRIX's function as a trend tracking indicator informs traders that positive Trix values indicate an uptrend, while negative Trix values indicate a downturn. When the Trix values run parallel to 0 (the center line), the market is considered neutral. The Trix oscillator is used to assess market overbought and oversold circumstances. Extremely positive readings indicate that the market is overvalued, while overwhelming negative values indicate that the market is oversold.

2.- Show how one can calculate the value of this indicator by giving a graphically justified example? how to configure it and is it advisable to change its default setting? (Screenshot required)
The TRIX indicator is previously known as a triple averaged EMA; it is essentially an EMA, of an Explosive Rolling Average (EMA), therefore the "triple." The EMA was often focused on the main price information of the sold commodity, as opposed to the simple average line (SMA), which just calculated the mean of the sold stock's values, with equal probability for any and all price information. costs.
Many marketplaces utilize a time of 15 as the default option for generating the TRIX indication; nevertheless, although with the default options, the parameters are adjusted to suit the trader's needs.
The TRIX, according to Professor @kouba01, is computed using the following formula:
TRIX = (EMA3 t - EMA3 t-1) / EMA3 t-1
When you do the aforementioned analysis, you will get a Trix signal on a graph which vibrates between 0 and 1, creating favorable and unfavorable values; hence, TRIX has always been favorable when the EMA is moving up and negative whenever the triple smoothed EMA is moving down.
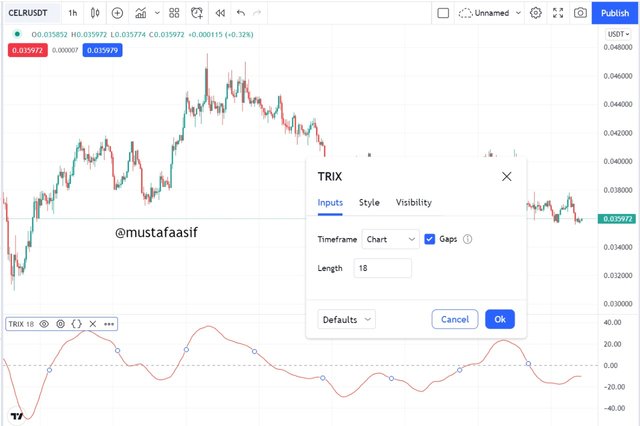
To adjust this indicator, choose that on the graph and click the customization icon; from that, you may make your changes; nevertheless, it is advised that you leave the default settings alone.

3.- Based on the use of the Trix indicator, how can one predict whether the trend will be bullish or bearish and determine the buy/sell points in the short term and show its limits in the medium and long term. (screenshot required)
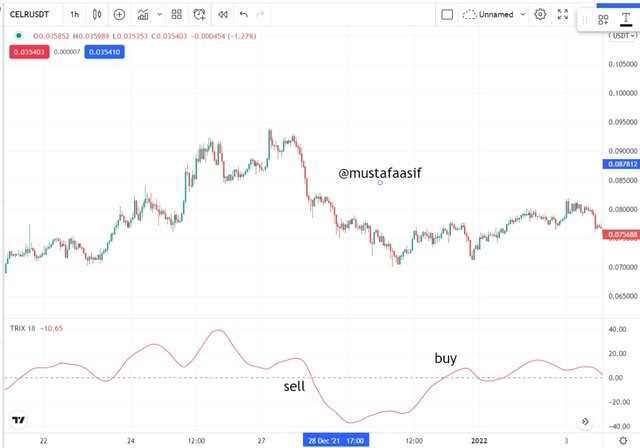
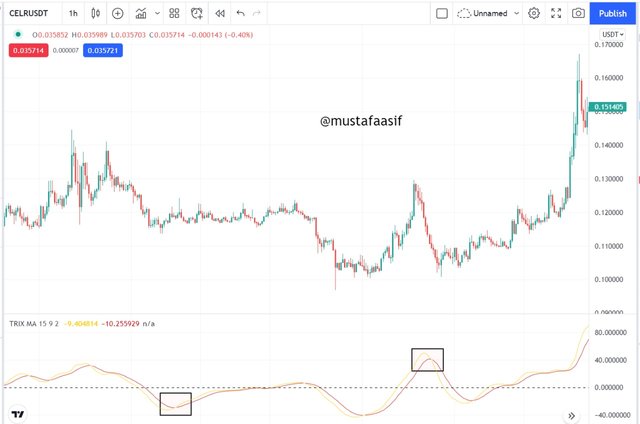
Whenever a dealer knows how well the TRIX signal operates, they may sell or go short when the TRIX line begins to move downward. As seen in the diagram below:
The shaded area inside the graph shown represent whenever the Trix Index sends or signals a sales forecast, whereas the blue dots suggest when the Trix Indicator sends or signals a purchase signal. You must ensure that the price of the traded item is moving down or up while making your forecast.
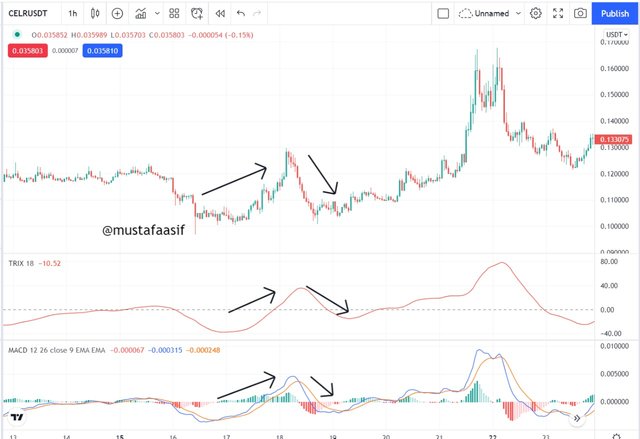
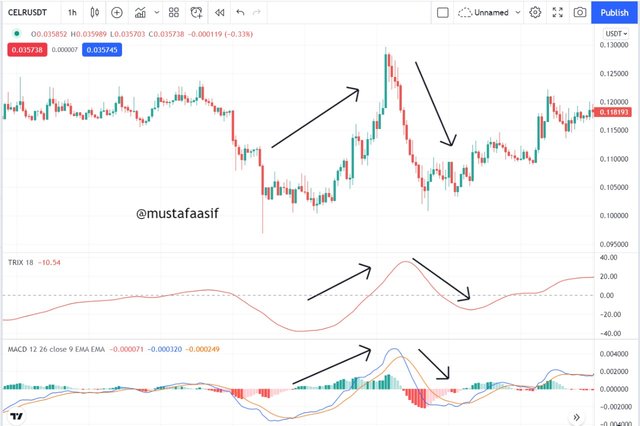
Another approach to utilize the TRIX indication is to combine it with the MACD indicator; because they both look to be of the same on a graph, their method helped traders avoid false breakouts. Here is an example of a graph:
The TRIX indicator may also be used in conjunction with the indicator that uses exponential moving averages (EMA). For which a TRIX of 18 periods and an EMA of 9 days must be used. When the TRIX and the exponential moving average (EMA) intersect while remaining below the neutral line, buy indications occur. When this occurs, a negative signal will most likely arise when the crossing comes over the neutral line. This example will be represented as a graph later on.

4.- By comparing the Trix indicator with the MACD indicator, show the usefulness of pairing it with the EMA indicator by highlighting the different signals of this combination. (screenshot required)
Because the MACD indication is a velocity and pattern tracking indication, its conjunction the with TRIX marker giving access with an excellent signal that can be utilized to join emerging styles and leave patterns whenever a reverse is imminent. Whenever the TRIX indication exceeds the zero (0) line and the MACD crosses, an entry signal is generated. For example, a purchase order will be placed when the TRIX indicator crosses the zero (0) line from below and enters the MACD indicator's oversold sector. The MACD indicator provides a signal earlier whenever it passes through into overvalued zone, but investors who seem to be disciplined sufficient waiting for the TRIX indication to cross the zero (0) line from the other direction.
And see how the two parameters vary, view a 15-period TRIX and a 9-period EMA and examine the chart behavior; where you can see that both indicators are moving around the zero line (0) and have a comparable buy signal, the 9-period EMA. In terms of mobility, the TRIX indicator has a smoother trend than the MACD indicator, as shown in the chart below.
The TRIX indicator's grade is in the trend region, and it is of great benefit to investors to prevent false signals that are less relevant in trading than the MACD indicator. By combining the two indicators, you can see that TRIX provides three crucial indications to traders. These three signals are described in further detail below.
The crossover of the neutral zero line (0) signifies a second confirmation of the preceding Indication, which verified either a bullish or bearish trend. The TRIX indicator provides a vital warning about a possible trend shift. The TRIX indicator's signal line breakout is what offers an indication of the initial potential direction of price changes.

5.- Interpret how the combination of zero line cutoff and divergences makes Trix operationally very strong.(screenshot required)
The TRIX indicator assists traders in assessing a sold asset or investment velocity. If the center line, zero (0), crosses from below, it indicates that impetus is growing in the market and traders might take advantage of opportunities to place buy orders. Furthermore, a center line crossing from above indicates that velocity is declining, and investors can seize the opportunity to put a sell order trade.
When TRIX crosses the zero (0) line from bottom to top, it is stated that now the marketplace for the traded asset has started moving in an upward trend, whereas when it crosses the zero (0) line from top to bottom, it is said that the market for the sold commodity has taken a big step in a downward trend.
Essentially, TRIX is typically powerful enough when a substantial technical collapse, dynamical supporting and opposition levels crumble, or better yet, utilized in conjunction with a price split is encouraged.
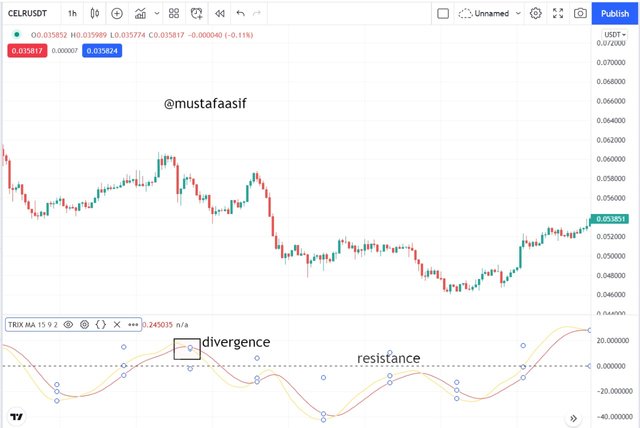
Dealers could also use the TRIX indicator to predict when a key pivotal moment in the market for the sold commodity will happen. Essentially, it is achieved by way observing dissimilarities, as happen whenever the value of the purchased item swings in the reverse way of the TRIX. Whenever the value of the traded asset makes greater highs but TRIX makes lower highs, it indicates that the uptrend is waning and that downtrend booking is imminent (i.e. will take place). When the price of the traded asset is making lower lows, this is the inverse of whatever we are stating. However, the TRIX indicator is producing higher lows, indicating that an uptrend reserve is likely to develop.

6.- Is it necessary to pair another indicator for this indicator to work better as a filter and help eliminate false signals? Give an example (indicator) to support your answer. (screenshot required)
As an exponential moving average (EMA) indicator, the TRIX indicator typically displays leading signals; hence, it is critical to match TRIX with other indications while following price to identify likelihood with high possibilities.
The following seem to be the most often used TRIX pairs:
6.1.- Aroon Indicator
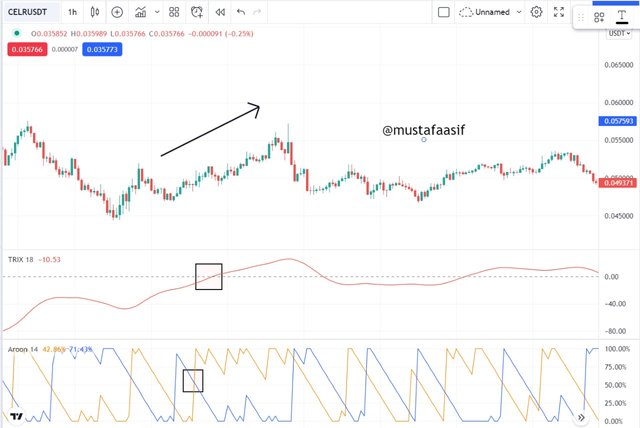
It is regarded as one of the greatest indications that can be served with TRIX. Take a look at the graph below:
The Aroon indicators provide three distinct unambiguous indications that may be utilized to enter and leave the first downtrend, when the TRIX enters the sell zone and then provides no exit signal, as shown in the chart above. On the chart, you can also see that the volume has been low for years but that the price is likely to begin getting promoted in phase 3.
6.2.- TRIX and Relative Strength Index (RSI)
The Relative Power Index (RSI) assesses a trend's speed and intensity. When paired with the TRIX indicator, it aids in providing distinct buying or selling indications whenever the sold price of bitcoin is implied vol. If both TRIX and the RSI are in an overbought range, a solid buy signal is generated, indicating a likely loss of momentum. Also, if both TRIX and the RSI are oversold, a sharp sell-off occurs, signaling a likely loss of momentum.
6.3.- TRIX and MACD
When combined with the TRIX, the MACD is a velocity and trend tracking indication that offers unambiguous indications to enter new trends and exit the trend when a reversal is about to occur. As previously indicated, an enter signal is generated when the TRIX crosses the zero (0) line and a MACD crossing occurs. A purchase order is placed, for example, when the TRIX crosses the zero (0) line from below and enters the MACD's overbought sector. A patient trader might wait for the TRIX to hit the zero (0) line from the reverse way after receiving this early entry signal when the MACD crosses into the overbought area, as explained previously.

7.- List the pros and cons of the Trix indicator:
The TRIX, like other signals, has strengths and drawbacks, which will be discussed below:
| Advantages | Disadvantages |
|---|---|
| Even while working on longer time periods, the TRIX indication filters out noise. | The fact that it slows somewhat when sending signals. This problem derives from its computation algorithm, which calls for the EMA as a basic parameter. The Trix indicator will always lag slightly behind the rolling average data. |
| Identify the path of the major market trend with a high degree of accuracy, allowing it to be checked twice. | On rare circumstances, this indication may fail to provide signals and stay passive, necessitating the use of an extra filter indicator to assist in such cases. |
| The TRIX indication can reveal divergent signs on the price graph. |

Conclusion
The TRIX is an excellent indicator for related incidents both in short- and long - term. It may determine direction of the trend and provide potential entry opportunities, as well as pinpoint extreme levels that can be utilized as exit criteria for a certain trade. This indicator has shown to be more useful than the MACD indicator since it offers indications even without indicator's own discontinuous swings.
Likewise, this should be highlighted that perhaps the TRIX indication needs a supporting indicator, such as the Aroon indicator, to assist filter out Trix noise and adjust for delays.
#club75 #kouba-s6week3 #steemexclusive #cryptoacademy #trix #pakistan
