Steemit Crypto Academy Season 3 - Week 3 | All about Trends, Supports and Resistances and simple chart patterns. [Assignment By @oluwatobiloba]
It is with great excitement that I am participating in this week’s homework task by professor @lenonmc21, as attending the class has thoroughly provided more explanation on the topic of charts and trends, it is easy to understand because it serves as a continuous lecture of last week’s lesson. Moving straight to providing answers to the homework task for the week.

Define in your own words what is a ‘’Trend’’ and trend lines and what is their role in charts?
Before emphasizing the topic, I will like to do a few introductions on the background of the topic. Before you can talk about trend trading, support, and resistance, you need to first understand that they are tools used for trading. A market is a place for buyers and sellers to exchange/trade services, goods, commodities, foreign currency, and so on. Unlike the contemporary goods market, there is the financial market, stock exchange market, commodity market, and so on where traders come to buy and sell currency, derivatives, options, and so on.
With this said, Trading is the market is the buying and selling of options, stocks, cryptocurrency, forex, bonds, derivatives, and so on for the purpose of making a profit. In other to make a profit, traders use strategies and plans to understand the market movement and be able to predict the next movement of the market. Traders in the market can go long just as much as they can go short, but this happens after careful analysis of the market. The analysis includes "Fundamental Analysis" and "Technical Analysis", the former isn't something traders use often but the latter is where part of today's post, falls into.
Fundamental Analysis is the study of the factors that affect the supply and demand, as well as the future growth of the entity behind the market. Fundamentals include News, Geo-politics, Weather (Draught/flood), Financial statements, Inflation and so on.
Technical Analysis is the use of charts by traders to study the history of an asset's price and to determine the possible future movement of the price. It is basically the recognition of prices and volume to determine the price of the market.
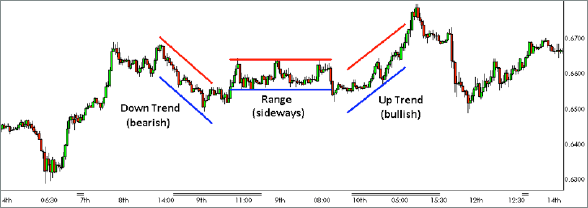
With technical analysis, candlesticks chart form trends as a result of price movement which goes upward, downwards, and to the right. The movement of the market price in a direction is a trend. A trend can go upwards in a bull market downwards in a bear market and sideways when the market is stable.
Trends are observed to occur within a particular time frame, this occurrence could be within periods of hours, days, weeks, or even a month.

What are trend lines?
Trend Lines are lines used to identify and confirm the movement of an asset price. It is used to determine the strength and length of a price movement. In other to determine the trendline in a chart, a minimum of two or three candlestick price points should connect. Trendlines helps to determine if a trend is an uptrend or a downtrend. Trend lines could be Body to Body trendlines, and Wick to Wick Trendline.
The role of a Trend Lines in charts.
When traders study a trend line properly, it will help them identify the best time to take advantage of buying and selling opportunities.
- Trend lines make it very easy for traders to identify the point of support and resistance in a chart.
- It helps to understand the market range in a more effective way.
- A trend line can be used as a tool to predict easily how high or low the price of an asset would go.
- In an uptrend, the lows are usually joined and in a downtrend, the highs are usually joined making it easy to pick on points
Explain how to draw an uptrend line and a downtrend line (Show a screenshot of each).
In order to draw a trend line, there are certain things we must take into consideration:
We must figure out at least two strong points, either to the top or to the bottom, they are the significant points that will determine a trading pattern and trend. Having a definite time frame in mind will make the process of drawing a trend line easier, each time frame can indicate a different trend, depending on the timeframe of the chart. Before drawing a trend line, remember to zoom your chart until you are sure to have gotten the clear information needed from each candlestick to draw out the trend line.
How to draw an uptrend line.
An uptrend line signifies that there is a constant rise in price as well as an increased customer demand (It is a positive slope), the line is drawn to connect two to three low points and the second low line has to be significantly higher than the first one (It is a trend that follows a higher low and a higher high). In order to draw a successful Uptrend line, we need to realize that trying to force a straight line where there is none will definitely affect our interpretation of the market.

How to draw a downtrend line.
A downtrend line must also have two to three connecting points where there is a lower high point forming a trend. A downtrend line signifies that there is less demand of an asset as well as a declined price also. The slope of a downtrend line is negative and it will be formed by connecting two to three high points, the second high point must be lower than the first high point.

Define in your own words what support and resistances are and how we can identify both zones. (Show a screenshot of each one).
These two are very important concepts that cannot be ignored in technical analysis. It helps traders figure out what signifies a good point of entry and exit. Support and resistance are points where prises, reverse, or stay for a period of time. The direction at which the prices reverse is what differentiates support and resistance.
Support.
A point of support is a very essential point in a trading chart where the price of an asset maintains a point for a period of time or reverses. Whenever there is a continuous fall in the price of an item as displayed on a chart, it gets to a point where it appears there is an edge and that point prevents it from falling even further that is exactly the point of support. The particular point when there is a change of direction from the continuous price decline is where we say we have hit the point of ‘’Support’’.

The point of support can automatically be termed as a point of resistance when the speculated price zone gets exceeded.
Resistance.
The point of resistance on a trading chart can be visualized whenever there is a sudden halt to the continuous rise in price and we have a sudden price drop, this often signifies that there is a huge sell of the asset in question and at this particular point of change can be described as the point of ‘’resistance’’. In a similar vein, a point of resistance can immediately change to a point of support when there is a break in the price zone.

How to identify the point of support and resistance on a chart.
The point of support and resistance can easily be identified on a chart, all that is required of us is to look out for that point where there is a change in price, the immediate change in price will most likely call for a continuous trend and that point of change is of a serious relevance either it has occurred in an upward or a downward movement pattern. For example, say we are studying a chart of BTC and the price was struggling between $12,000 - $20,000 but suddenly hits a point where the price skyrockets to $30,000, and then the trend continues to move up from there that point of support needs to be noted and considered a great point of relevance.
Explain in your own words at least 2 simple chart patterns with screenshots.
The market is always made up of a constant varying price of demand and supply (an unstable point), chart patterns is a part of the technical analysis tool used in trading, and understanding these patterns will definitely give traders a suitable trading result.
Double Top/Roof and Double Bottom/floor
Double Top/Roof
This chart pattern is not very common but it signifies a point of reversal after the market has experienced an extensive bullish trend, the point where there is a halt to that bullish pattern and then it comes down then goes back up to continue the pattern of movement, it is often considered as the ‘’Double Roof’’ point. The double top/roof chart pattern could significantly indicate the end of a bullish trend which could have occurred as a result of the exhausted amount of buyers and then people begin to sell off their tokens. It gives an M shape where there is a resistance at a price thereby giving a strong reversal signal.

Double Bottom/Floor.
This chart pattern indicates the level touched after the market has experienced an extensive bearish trend. The double floor pattern is picked from the exact point where it appears we can find an indicated stop to the downward pattern and then it goes down a bit and of course heads straight back up to continue to trend.
The double bottom/floor pattern could also signify the end of a bearish trend and have price been reversed in the opposite direction which implies there are more buyers and of course a significant rise in price as well.

Conclusion.
I really appreciate this class because it is increasing my knowledge in the world of cryptocurrency charts, this class that we are gaining knowledge from is what we would have paid for on a neutral ground. I say a big thank you to the steemit team and definitely to professor @lenonmc21 for taking us through this extensively educating topic.