Crypto Academy / S4W4- Homework Post for @reminiscence01

image created on picsart

1a) Explain Leading and Lagging indicators in detail. Also, give examples of each of them.
b) With relevant screenshots from your chart, give a technical explanation of the market reaction on any of the examples given in question 1a. Do this for both leading and lagging indicators.
2a) What are the factors to consider when using an indicator?
b) Explain confluence in cryptocurrency trading. Pick a cryptocurrency pair of your choice and analyze the crypto pair using a confluence of any technical indicator and other technical analysis tools. (Screenshot of your chart is required ).
3a) Explain how you can filter false signals from an indicator.
b) Explain your understanding of divergences and how they can help in making a good trading decision.
c) Using relevant screenshots and an indicator of your choice, explain bullish and bearish divergences on any cryptocurrency pair.
1a) Explain Leading and Lagging indicators in detail. Also, give examples of each of them.
In crypto trading market, there are tools use by a technical traders to help them signify market trends, this tools are called indicators. And this so call indicators are categorized into two different type which are the leading and lagging indicators. Let briefly explain them

image created on picsart
Looking at the leading indicator, this indicator are technical tools that are used by the technical traders to signify the future direction of the trading market, it intepret to the traders where the price is heading, which means it will help the traders to predict market movement before time.
By this leading indicator, giving a correct signal to it technical traders it can enable those traders to get into the market before there is market movement and take advantage of it. By this the are tend to make profit.
Though leading indicator has alot of advantages but there is also a disadvantage due to the fact that it do not guarantee 100% accuracy which means there are not 100% accurate in giving correct signal, to tackle this disadvantage, technical traders usually combines them with other forms of technical analysis.
In general, leading indicator gives signal or alert to technical traders before the new trend or market movement and also measure how 'overbought' or 'oversold' an asset his.
Examples of leading indicator
- Ichimoku indicator
- momentum indicator
- stochastic oscillator
image created on picsart
Lagging indicator are types of indicators that give signal when the price movement has already passed or when the price movement is taking place. That is to say it gives signal when trends has started or already taking place.
With the help of this indicator the technical traders confirm the price trend before entering a trade.
Unlike the leading indicators,lagging indicator give more accurate signal. By this process of giving more accurate signal it will result in slowing to react,therefore makes the technical traders venture into the market late which might cause a negative impact by making traders gain fewer profitable pips.
This lagging indicator simple tells traders which price is rising and falling so that this traders can trade properly.
Examples of lagging indicator
- parabolic sar
- Exponential moving average(EMA)
- Bollinger bands
With relevant screenshots from your chart, give a technical explanation of the market reaction on any of the examples given in question 1a. Do this for both leading and lagging indicators.
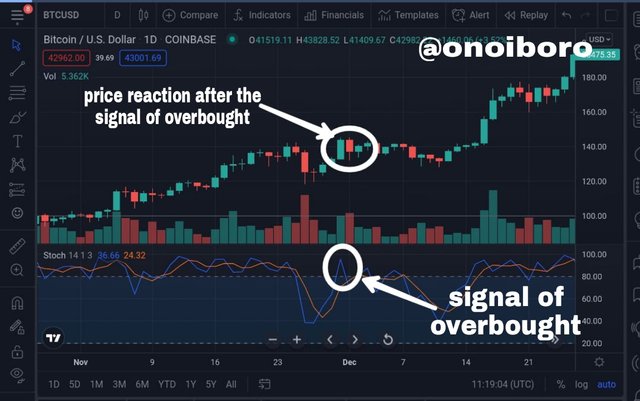
Screenshot of BTC/USD in tradingview
Above is a leading indicator called stochastic oscillator with a BTC/USD chart showing the signal where the price is heading. Over there it signify a future uptrend long before there was even an uptrend. Like i say before at this point, technical traders are expected to go into the market and take advantage of it.
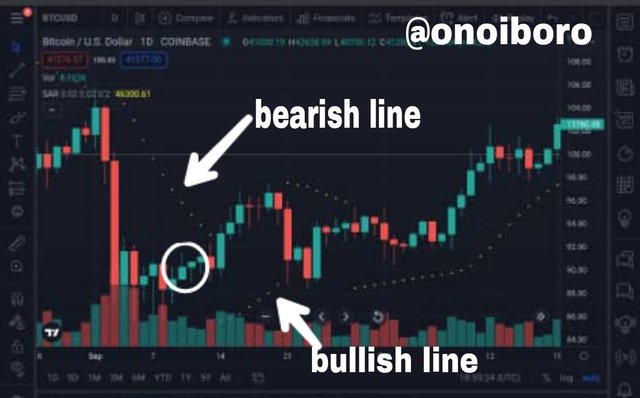
Screenshot of BTC/USD in trading view
Above is a lagging indicator called parabolic sar with a BTC/USD chart.
As seen above the series of dot above the price is said to be the bullish while the dot below the price is said to be a bullish signal.
As seen above,the signify point shows that the market price started making moves before the indicator followed and it gave signal after bullish candle has been formed. By this we notice that the parabolic sar indicator gave signal when price movement has already pass.
2a) What are the factors to consider when using an indicator?
To achieve a successful trading, as a technical trader using an indicator for technical analysis, then the must be certain factor you need to put into consideration when using this indicator.
You must understand the type of indicator you are using.
As a technical trader first of all you need to have a better understanding of the type of indicator you are using, that is to say you must have a fore knowledge and understanding of it configuration before proceeding to use them,cause different indicator as pron and con and can always affect your trading decision.
It is advisable to use your risk appetite to decide which of the type of trading indicator will best fit your trading strategy.You must understand you trading strategy when using an indicator
In trading the are different trading strategy involve which are
day trading:-this implies traders to buy and sell asset within the same day.
position trading:- this strategy uses long term chart to assume the trend of the current market direction.
swing trading:-this strategy bring about buying and selling asset as volatility set in.
scalping trading:-this strategy look for continous liquidity in the market to make the trade momentum high.
All this trading style has indicator that best fit them,technical traders can choose any trading style favourable to them and then chose or configure an indicator to best suit the trading style.You must understand you market trend when using an indicator.
Market can either be trending or ranging where trending market is the one that price move in one direction. by this trader focus on using RSI and stochastic indicator to know if the market is trending while the ranging,price moves in forward and backward between the high price and low price. By this trader focus on using momentum-based and volatility-base indicator to know if the market is ranging.
By understanding this market trend,traders can attract gain through the analysis of an asset momentum in a certain direction and also help the traders to sell their asset at high price and buy at low price.
b) Explain confluence in cryptocurrency trading. Pick a cryptocurrency pair of your choice and analyze the crypto pair using a confluence of any technical indicator and other technical analysis tools. (Screenshot of your chart is required ).
Confluence has the word implies has different meaning, but when it comes to crypto trading it talks about the combination of two or more trading analysis or indicator to confirm the validity of the buy and sell signal during trading.
With this method, technical traders can use the combination of different technical tools to determine whether any particular trade has better chance of success or it will determine if it worthy of trading.
This confluence normally helps elimate the weakness of the technical tool or indicator when use separately.
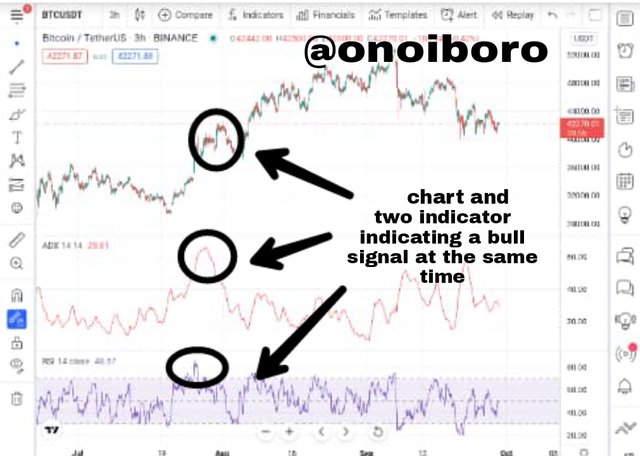
The screenshot of BTCUSDT chart
In this chart there are two indicators. Average directional index(ADI) and RSI showing the signal of uptrend at the same time. This chart simply explain confluency.
3a) Explain how you can filter false signals from an indicator.
Firstly before filtering out false signal we must first know how to detect false signal.in other words, knowing when the signal is correct and when the signal is fake.
Though the are different ways of detecting false signal let simply look at this one.
When a signal is correct an indicator will indicate, showing the signal and with that the market will react to it. But if the market gives an opposite reaction we say the signal is fake, by this it give a false price movement.
So to filter or avoid this false signal you can always use multiple indicator and chart. Not always putting your trading decision on one method. By this way,you confirm the signal with other indicator. that way confluence comes in.
b) Explain your understanding of divergences and how they can help in making a good trading decision.
Let make a little explanation to understand divergence
In a process where price is making higher high an the technical indicator should also be making higher high, if the price is making lower low then the indicator should follow suit. If it happens contrary then we say the price and the technical indicator is diverging from each other by this explanation we can understand what divergence means.
So with that explanation we can simply say divergence is when a price of an asset is moving in an opposite or contrary to the technical indicator. It warns the traders that the current price is trend is weakening and might result to price changing direction.
Divergence helps the technical traders to sight and react appropriately to the change in price action. It informs the trader that something is changing which the trader must make a decision such as tightening the stop-loss or take profit.
c)Using relevant screenshots and an indicator of your choice, explain bullish and bearish divergences on any cryptocurrency pair.
bullish
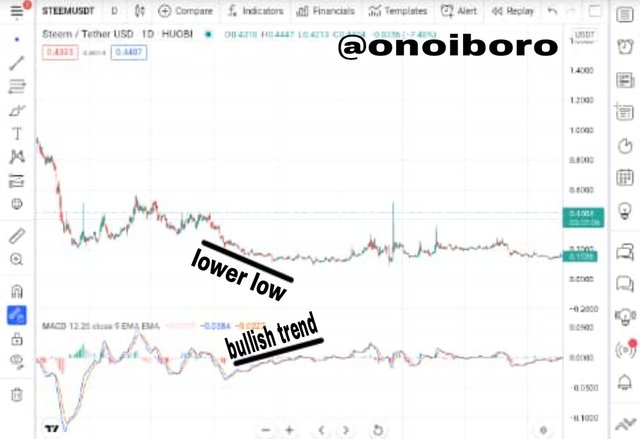
Screenshot of STEEMUSDT chart from tradingview.
Above image portrait a bullish divergence which occur when a price fall to a new low( showing downtrend) while the indicator(MACD)signals an uptrend contrary to the price as seen above.
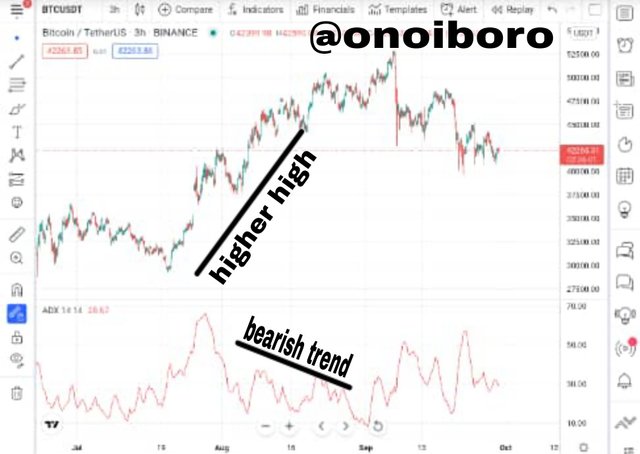
Screenshot of STEEMUSDT chart from tradingview.
Bearish divergence occur when there is a potential downtrend,when a price rise to a new high(higher high) while the indicator(ADX) shows a downtrend of lower low as seen on the image above.
conclusion
In the crypto world, technical indicators are very important to the technical traders in terms of analysing market price and predicting future price of asset.
This indicators are always categories into different type Which are leading and lagging indicators this two plays their part in increasing the success rate of trading provided the technical traders use it properly to fit their trading strategy.
Once again thanks you professor @Reminiscence01 for the well explanatory lecture, indeed have learnt alot.
Hello @onoiboro, I’m glad you participated in the 4th week Season 4 of the Beginner’s class at the Steemit Crypto Academy. Your grades in this task are as follows:
Recommendation / Feedback:
Thank you for participating in this homework task.