Price Action + Break-Even Technique - Crypto Academy / S4W4 - Homework post for @ lenonmc21

image created by me on picsart

Question
Define in your own words what Price Action is?
Define and explain in detail what the "Balance Point" is with at least one example of it (Use only your own graphics?
Clearly describe the step by step to run a Price Action analysis with "Break-even"?
What are the entry and exit criteria using the breakeven price action technique?
What type of analysis is more effective price action or the use of technical indicators?
Practice (Only Use your own images)
Make 1 entry in any pair of cryptocurrencies using the Price Action Technique with the "Break-Even Point" (Use a Demo account, to be able to make your entry in real time at any timeframe of your choice)

Define in your own words what Price Action is?

image created by me on picsart
In crypto trading, there are different ways in which technical traders use in studying and gaining more insight on the price trend or price movement,Price action are one of the ways,though technical indicator are the most common and popular way alot of technical trader use in analysing trade.
But to some it might not be the most effective tool as some trader often use price action as their preferred tools to trade.
Price action is a trading technique that allows the technical traders to understand the market, in other to make subjective trading decision using the recent price movement and the actual prices movement. By this,traders do not solely depend on technical indicator but rather focus on price action trading strategies to quickly gain profit over a short period of time.
This price action depends on past price(open,high,low and close) which will help the traders make better trading decision. Unlike other technical analysing tools, price action depends solely on the price of an asset in making trading decision by this it will ignore other fundamental factors which influence the market movement and base primarily on market price history and also focus on the state of the present market not the state of the price in future.

Define and explain in detail what the "Balance Point" is with at least one example of it (Use only your own graphics?

image created by me on picsart
Balance point which is also know as the break-even is a point when market price of an asset is the same as the original cost. This point are always reach when the two price are equal, the balance point on the chart below portraits that the last impulse of a bullish and bearish trend are equal..
You can spot out the balance point in the image below by checking the end of a candle in a particular trend as indicated below.
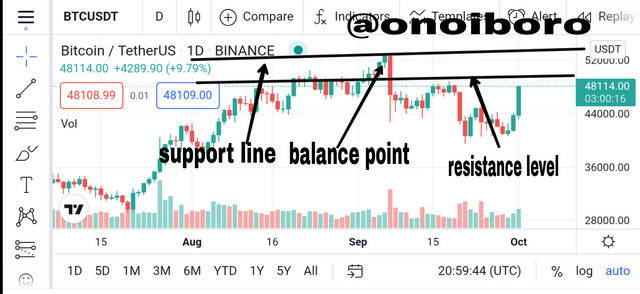
A screenshot of BTCUSDT chart in tradingview

Clearly describe the step by step to run a Price Action analysis with "Break-even"?
Break-even is a useful tool for determining what point your trade will be profitable.
To run a price action analysis using brea-keven you have to go through this process below.
step 1
You must select a comfortable timeframe on the the chart you are about using according to the type of trader you are, we have the day traders,position traders,scalp traders and swings traders if you belong to any category of this traders you must chose a timeframe that best fit you trading style. As a day trader you can choose 5minutes or 15minutes chart as a swings traders you can as well chose 1-4hour chart to fine-tune your market entry, so far you are comfortable with it.
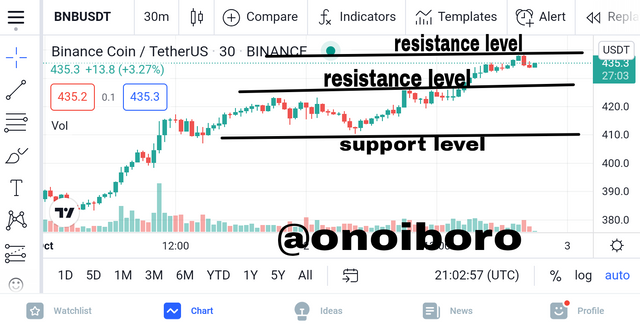
Screenshot of BNB/USDT from tradingview
Step2
Once you have choose a timeframe you will now proceed to mark the importance or critical area in the chart where the price react,which are there support and resistance level. It make it simple you can use horizontal line to indicate those important area. All this indicated area is important in terms of helping in gaining profit.
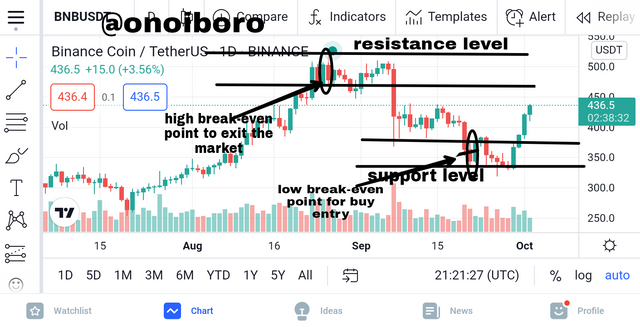
Screenshot of BNB/USDT from tradingview
Step3
Lastly, after successfully completing step1 and step 2, you then observed the market closely to know if the market is in an uptrend or downtrend, by this we can spot out a break-even point and then make possible entry into the market.

What are the entry and exit criteria using the breakeven price action technique?
The first criteria is to indicate the resistance and support level which will help find the break-even point. From the break even point you can see an indicated break, place at the top or bottom of the chart where the last candle in the uptrend and downtrend as been indicated,immediately the candle appears you can now take an entry and exit at the top and bottom respectively.
The second criteria is to place the possible stop-loss at the low of the hammer candle which forms the break-even point, this stop-loss helps minimize the loss a trader may get in an asset position. So if you place the stop-loss at 10% below the price at which you buy your asset, your loss will be reduced to 10% which will give you a risk ratio of 1:1.

What type of analysis is more effective price action or the use of technical indicators?
Before looking into the more effective technical analysis between price action and technical indicator let first understand what both means.
Price action is a trading technique that allows the technical trader to understand the market, in other to make subjective trading decision using the recent price movement and the actual prices movement.
While
Technical indicator are trading technique which are graphically represented or plotted as chart, with the purpose of forecasting or predicting the next market or price movement.
For me i prefer price action when looking at the profitable terms of it. When it comes to quickly generating of profit over a short time frame many technical traders prefer using price action trading strategy.
In other words,price action Is more profitable trading strategy when compare to technical indicator trading strategy and is more effective cause it depends solely on price of an asset to make their trading decision.
To me price action are more effective looking at some characteristics of indicators which they are complicated in trading, lagging in nature and not easily being able to dictate price. It is advisable to use price action to predict trend rather than technical indicator which may cause a pitfall for traders waiting to get confirmation signal from technical analysis.

Make 1 entry in any pair of cryptocurrencies using the Price Action Technique with the "Break-Even Point" (Use a Demo account, to be able to make your entry in real time at any timeframe of your choice)
Below i made an entry using a pair of NFT/USDT
I made a buy entry using my trading platform coldcoin which i bought an NFT token using USDT..
Below is the details of my buy entry i made using coldcoin
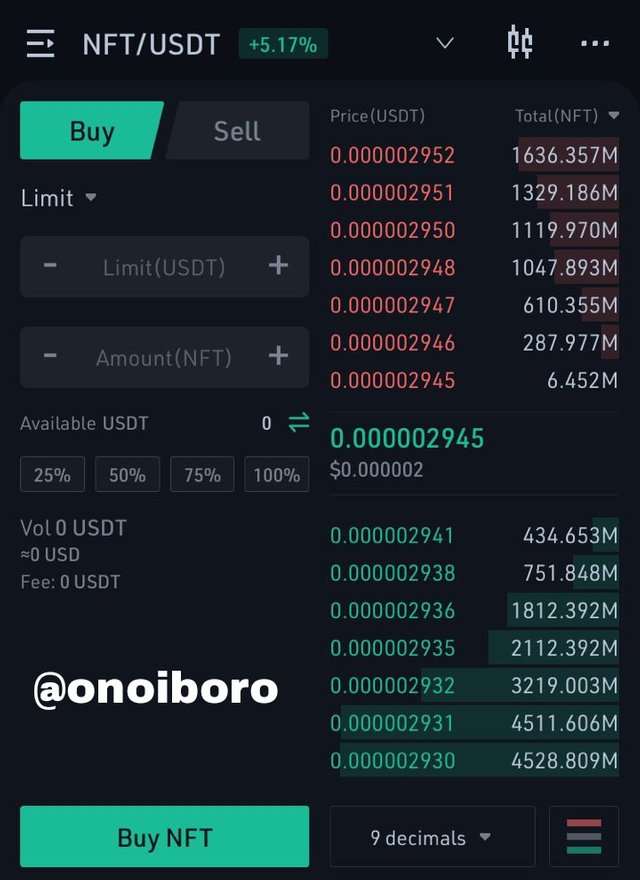
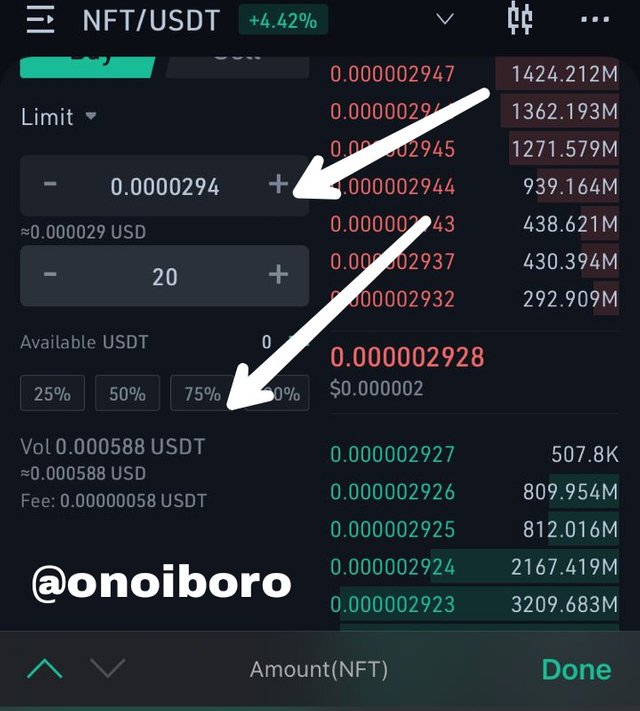
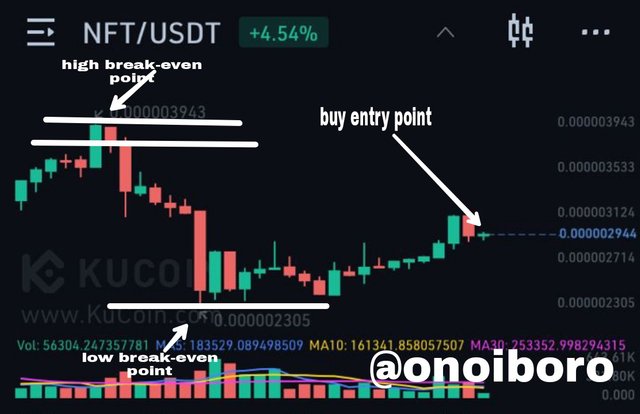
Proved of my buy entry.
conclusion
Generally,Looking at the high success rate of price action i will urge trader who are into other technical analysis tool to try use price action in performing analysis cause with the help of price action you can make profit and reduce losses.
Once again thanks @lenonmc21 for an interesting lecture like this, indeed have learnt alot.
