Cryptocurrency Market Weekly Report - Technical Review [100% power up ]
Hello Steemians.
The dip and pain caused by the market crash haven't shown any signs of recovery in the past weeks. The entire crypto market has lost more than 60% of its Market cap since reaching its all-time high at $2.9Trillion. The high-cap coins have lost more than 60% of their market cap while low caps coins and petty cryptocurrencies are struggling for stability.
Despite everything that had happened in the market these few months, the trading volume of the crypto market still remained stable with more than $75 billion 24hrs trading volume. In this post, we will be discussing the current crypto market situation. I hope you stay with me.
Total Crypto Market Cap Chart
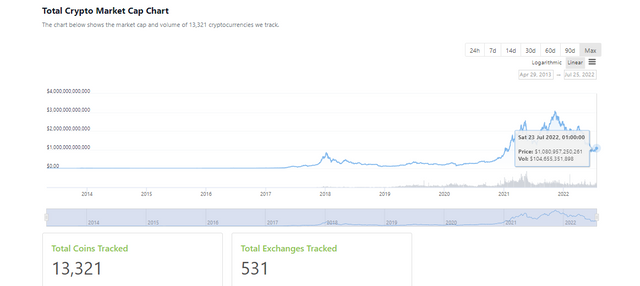
The chart above shows the total crypto market cap chart. From the chart above, the current market cap of the crypto market at the time of writing this post is $1trilllion. This is the lowest point since January 2021. The crypto market reached its all-time high of $2.9 trillion in November 2021. The data took into account 13,321 cryptocurrencies and 531 exchanges.
Bitcoin Dominance Chart
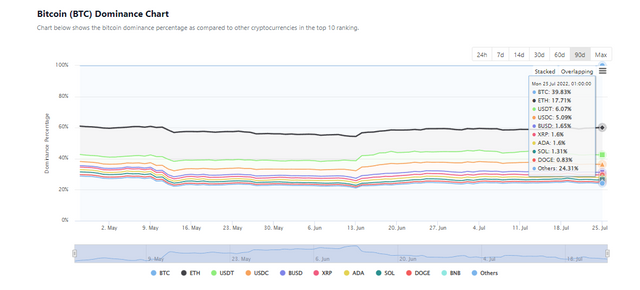
The chart above is the Bitcoin dominance chart over the rest of the cryptocurrencies. Dominance in the crypto market means the influence a certain coin/token has over the entire crypto market. Bitcoin has a dominance of 40% in the crypto market. This simply means that Bitcoin amount to 40% of the total cryptocurrency market cap. This is the reason the rest of the crypto market follows the direction of Bitcoin due to its dominance.
Bitcoin is gradually losing its dominance from 70% in 2018 with the emergence of Altcoins, DeFi projects, NFTs, and other amazing projects in the crypto market.
Altcoin Market Cap Chart
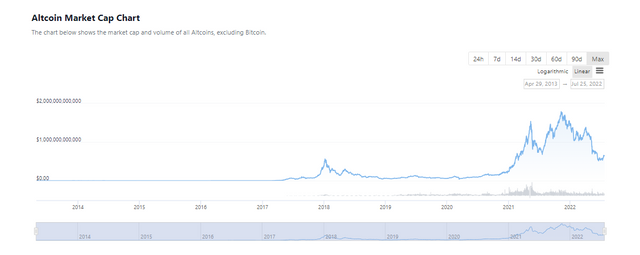
The chart above represents the Altcoin market cap. Altcoins represent the rest of the cryptocurrencies excluding Bitcoin. The chart shows the market cap of the crypto market excluding Bitcoin. The Altcoin market cap at the time of writing this post is $645 billion.
It hasn't been an easy journey since the beginning of the year for cryptocurrency investors. But we still trust and believe that the market will recover. In the next section of this post, we will be analyzing the market with emphasis on Bitcoin due to its dominance.
This analysis will be a multi-timeframe analysis that will be carried out on Tradingview
Technical Analysis
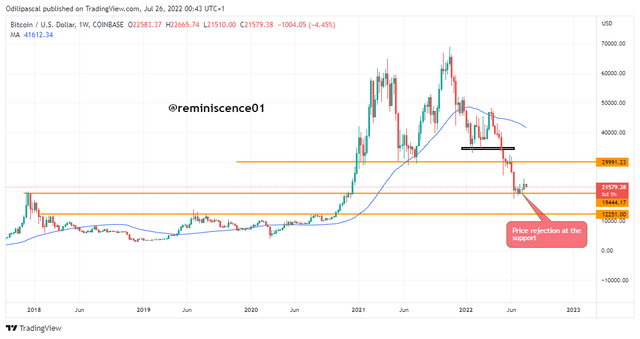
BTC/USD Monthly Chart
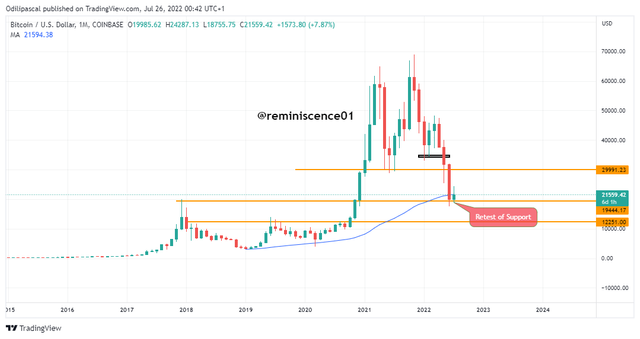
From the monthly chart above, we have what looks like the double top formation which is a strong reversal pattern. After this formation, price broke the neckline of the double top formation at $30k which is a strong confirmation for the reversal.
After this break, price came down to retest the previous support level at $19k. The previous monthly candlestick broke below the but failed to close below it. At this point, we can't confirm a break below the support until the next candlestick breaks and close below the support. Right now, price is being rejected at the support and we hope the market will take a turn from here.
BTC/USD Weekly Chart
Going down to the weekly chart to have a clearer picture of the market, we can have a better picture of price at the current support level. Looking at the candlestick formation, we can see price ranging on the support level despite multiple attempts to break the support. The support level is showing a strong rejection as price has failed to close below it.
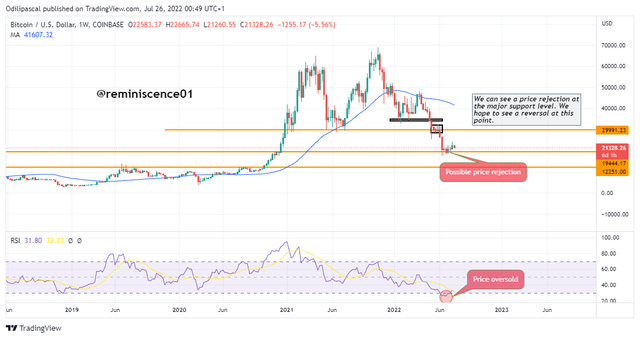
Adding RSI to the chart for confirmation, we can see that the RSI is at an oversold region which is a bullish reversal signal. But the current focus is on price action and from all indications, there are no signs of reversal.
BTC/USD Daily Chart
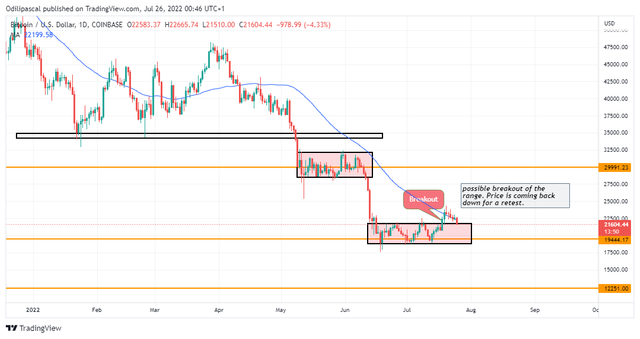
The daily chart is clearer. Nothing how the multi-timeframe analysis is helping us understand the overall price movement. Here we can see the price range clearly from the weekly chart. Price has broken out of the range with a possible retest of the broken range. If price reverses to the upside after the restart, we can see BTC to the resistance level at $30k.
In the next section of this post, we will be predicting the next price movement of BTC for the multi-timeframe analysis we have carried out.
Predicting the Next Direction of BTC/USD
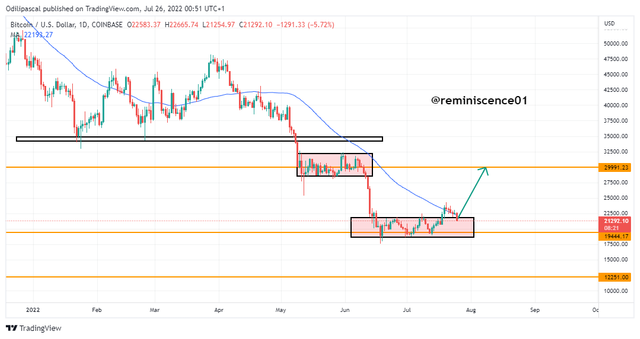
The first scenario is a bullish movement of price upon a successful breakout of the range. Here, we can expect a break and retest of the range for price to continue going up. At this point, the breakout isn't confirmed as price can go back into the range.
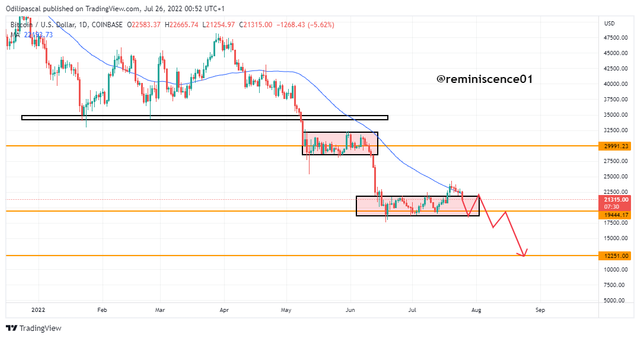
The next price movement will be a break below the support level. The bullish breakout can turn out to be a fakeout if price goes back into the range. This is a common trick the Big players use to manipulate and take money from retail traders. We have to ensure that we have all the necessary confirmation before making any investment decision.
In this study, we have looked at the current crypto market situation. We have also carried out a multi-timeframe analysis and have predicted the possible future price movement. I hope this information can help you to make good decisions in the market.
Note: This analysis is based on my personal opinion and knowledge. This is for educational purposes and not a piece of investment advice. Please do your own research and invest what you can afford to lose. The crypto market is highly volatile and risky.
Cc: @reminiscence01
Note: You must enter the tag #fintech among the first 4 tags for your post to be reviewed.
Very Insightful and useful Post .
Thank you.
Looking forward for more such post , I also write about crypto and blockchain , in the meantime you should check it out I think you will find it interesting.