Burned tokens, rewards, and inflation summary September 3, 2022 - Total burn estimates: 80,692K STEEM/SP and 54 SBD
Steemit launched the #burnsteem25 initiative on May 22, and the corresponding rewards started being delivered to @null on May 29. Subsequently, on August 9, Steemit announced that they'd be monitoring post promotions daily. Here is the next weekly update with PowerBI charts to visualize the burned token-related statistics since those dates.
Slide 1: Burn amounts in beneficiary rewards and transfers to @null.
Weekly totals were about 8,300 STEEM/SP and 4.5 SBD. An all time high of 727 SP burned in beneficiary rewards was observed yesterday (September 2). Hopefully, the number of unique post promoters in August (37) on the bottom-center graph is a little more readable this week. September doesn't have enough data to show up on the scale, but the number is 2.
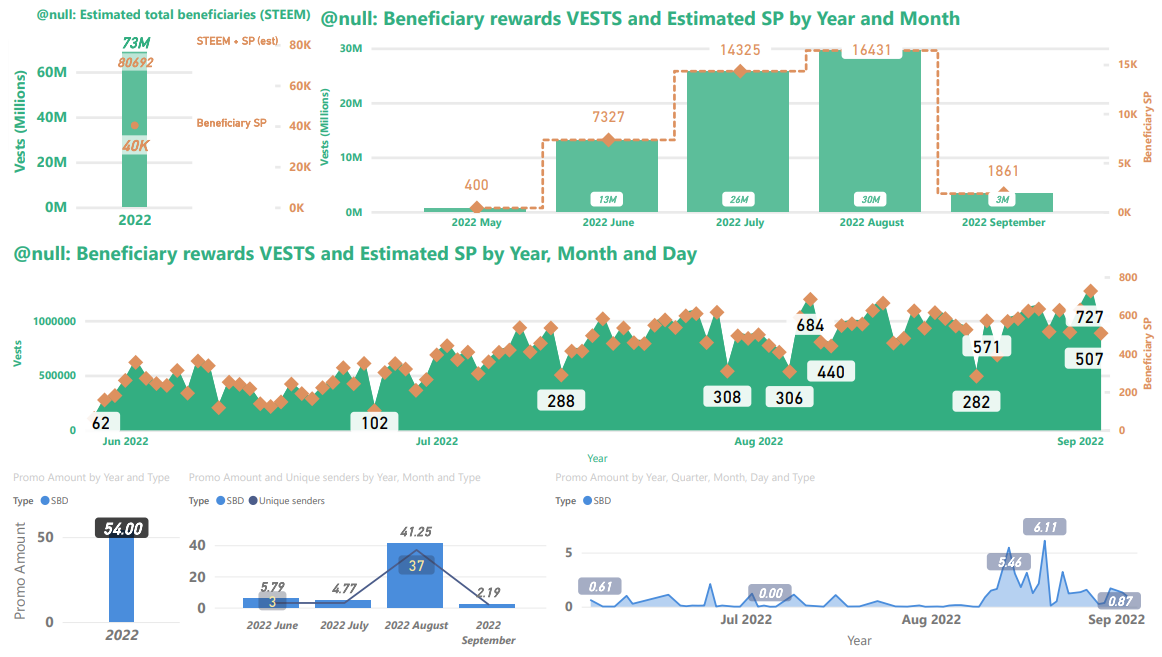
Top-left: This image shows the number of VESTS along with the estimated numbers of SP and ( SP + STEEM ) beneficiary rewards that have been burned since May 29. This is where the headline number comes from.
Top-right: This shows the VESTS and the estimated SP beneficiary rewards burned per month.
Middle: This shows the daily VESTS and the estimated SP beneficiary rewards that have been burned.
In all three of the above charts, VESTS are shown against the left axis, SP and STEEM are shown against the right.
Bottom: SBD transfers to @null. As readers are likely aware, SBD transfers to @null can get a post added to the /promoted page. The visualization on the left shows the breakdown by year. The visualization in the middle shows a monthly aggregation of SBDs transferred and a count of unique senders. The visualization on the right shows the daily record.
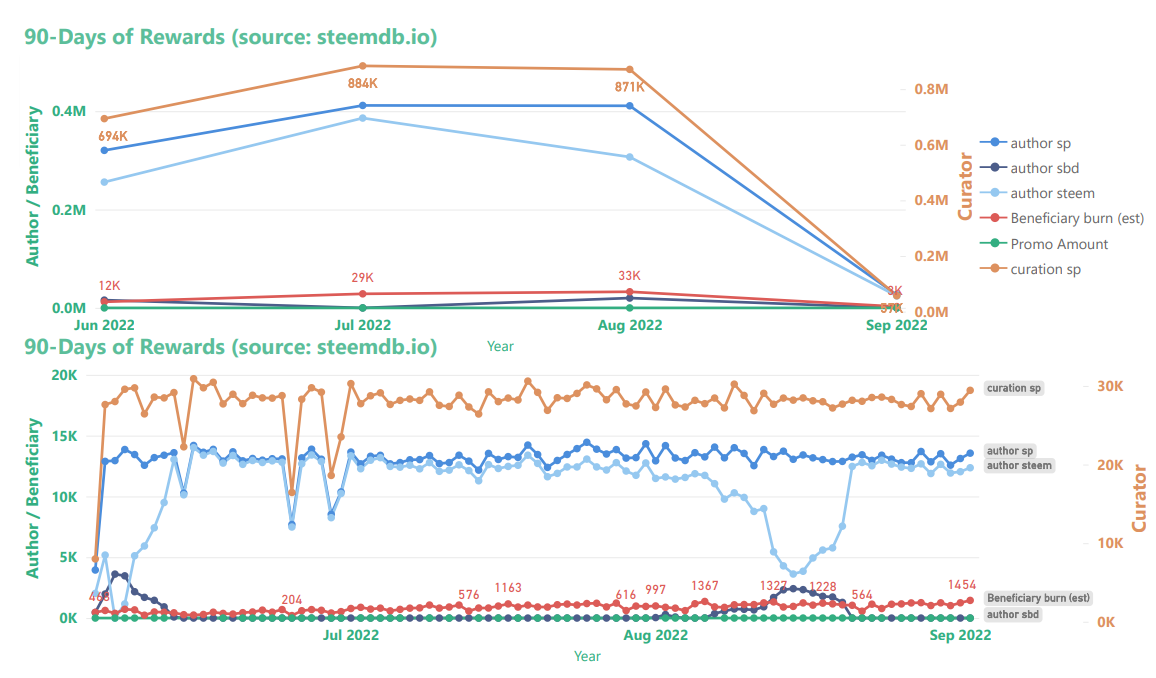
Slide 2: Rewards summary
Curator rewards use the scale on the right, author and beneficiary rewards use the scale on the left. Thus, curation rewards appear to be scaled down relative to author & beneficiary rewards. Beneficiary rewards for @null in this chart (red) have been adjusted in order to account for both SP and liquid rewards. The top graph shows the monthly aggregations, and the bottom graph shows daily totals.
Noteworthy this week is that SBD printing has remained paused, due to the continuing sluggishness in the price of STEEM (and crypto markets at large). With the present SBD supply, it looks like the median on-chain price for STEEM needs to get back to about $0.252 for SBDs to start printing again.
Slide 3: STEEM & SBD Supply as well as vested (i.e. staked or "powered up") STEEM
Noteworthy this week is that the percentage of liquid STEEM has declined as a percentage of both current STEEM supply and virtual STEEM supply. Also, the slope of the SBD supply growth curve leveled off a bit because new SBDs are not being distributed to authors.
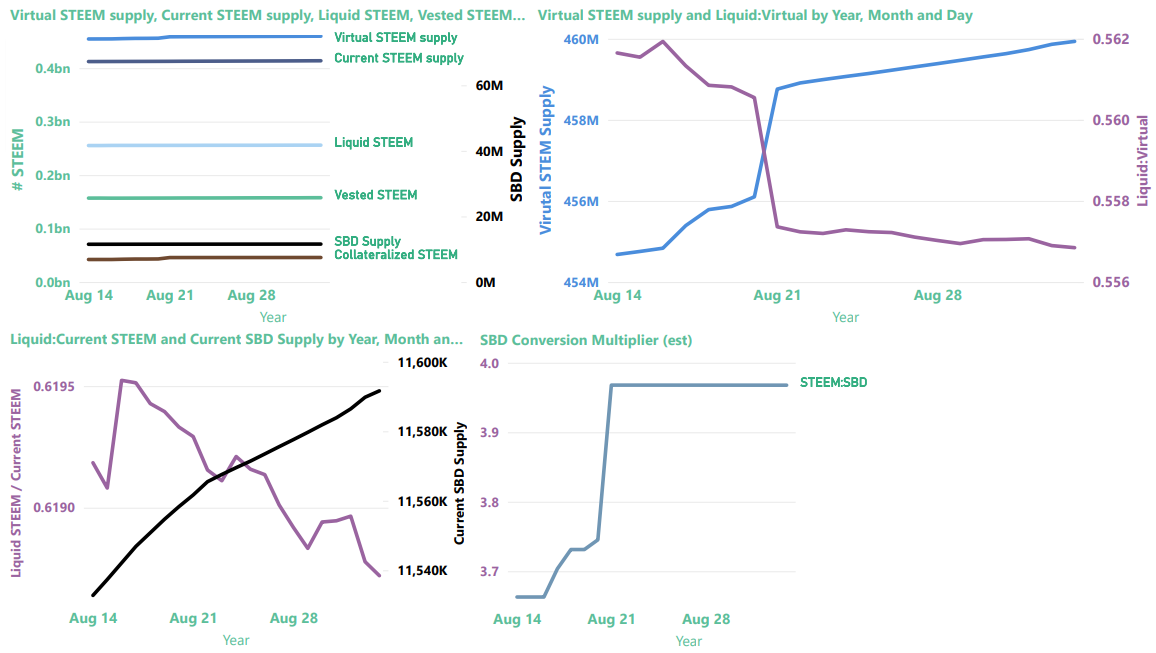
The top-left image provides a summary view of current and virtual STEEM supply, current SBD supply, liquid and vested STEEM, and the amount of STEEM reserved as collateral for paying off SBDs.
| Note |
|---|
Collateralized STEEM and current SBD supply actually represent the same value expressed in terms of STEEM or SBDs, respectively. They're aligned differently on the graph because they use different axes. |
The top-right graphic now contains a zoom-in on "virtual STEEM Supply" (left axis) and the ratio of liquid STEEM / virutal STEEM supply (right axis). As we learned, here, virtual STEEM supply is heavily influenced by price, so with STEEM prices down, it's not surprising to find the virtual STEEM supply increasing. The up-side of this is that it's now possible to burn more collateralized STEEM per SBD with post promotion.
The bottom-left visualization now contains the ratio of liquid STEEM / current STEEM supply (left axis) and a zoom-in on Current SBD supply (right axis)
The chart on the bottom right shows the value of SBDs in terms of STEEM, according to the blockchain conversion rate, not external markets. This is the inverse of the blockchain's: internal price (which is different from the actual feed median, for reasons that I don't currently understand).
Now, here are some more details about each of the values
| Parameter | Axis (left/right) | Meaning | Comments |
|---|---|---|---|
| SBD Supply | right | Number of SBDs in circulation | Equivalent in value to collateralized STEEM |
| Collateralized STEEM | left | Number of STEEM needed to pay off all SBD debt | Equivalent in value to SBD Supply |
| Vested STEEM | left | Number of STEEM staked as STEEMPOWER | |
| Liquid STEEM | left | Number of STEEM that's not staked or needed for SBD collateral | Calculated as (Current STEEM supply - Vested STEEM) |
| Current STEEM supply | left | Number of STEEM in circulation | |
| Virtual STEEM supply | left | Number of STEEM in existence |
Thanks for reading!
For previous updates, see:
- Burned tokens, rewards, and inflation summary August 27, 2022 - Total burn estimates: 71,850K STEEM/SP and 49 SBD
- Burned tokens, rewards, and inflation summary August 20, 2022 - Total burn estimates: 64,876K STEEM/SP and 37 SBD
- Burned tokens, rewards, and inflation summary August 13, 2022 - Estimated beneficiary burn since May 29: 56,855 STEEM
- Burned tokens, rewards, and inflation summary August 6, 2022 - Estimated beneficiary burn since May 29: 49,365 STEEM
- Burned tokens, rewards, and inflation summary July 30, 2022 - Estimated beneficiary burn since May 29: 42,556 STEEM
- Burned tokens, rewards, and inflation summary July 23, 2022 - Estimated beneficiary burn since May 29: 35,497 STEEM
- Burned tokens, rewards, and inflation summary July 16, 2022 - Estimated beneficiary burn since May 29: 28,408 STEEM
- Burned tokens, rewards, and inflation summary July 9, 2022 - Estimated beneficiary burn since May 29: 22,185 STEEM
- Burned tokens, rewards, and inflation summary July 2, 2022 - Estimated beneficiary burn since May 29: 15,312 STEEM
- Burned tokens, rewards, and inflation summary June 25, 2022 - Estimated beneficiary burn since May 29: 12,412 STEEM
- Burned tokens, rewards, and inflation summary June 18, 2022 - Estimated beneficiary burn since May 29: 8,994 STEEM
- Burned tokens, rewards, and inflation summary June 11, 2022 - Estimated beneficiary burn since May 29: 6,492 STEEM
Pixabay license, source
Reminder
Visit the /promoted page and #burnsteem25 to support the inflation-fighters who are helping to enable decentralized regulation of Steem token supply growth.
The present value of the assets burned in the Steem ecosystem is around K$17-18. We need to do different activities in order to increase the number of burned steems.
This post has been featured in the latest edition of Steem News...
I am not sure but I think this burning project should be expanded widely for better feedback.
Burning coins when the supply is tto much is one of the best way to control and stabilize the price of it. Hope this burning project will bring something good for steem.
That should be good for all of us..
I think more is needed