[REPOST][CRVUSDT Futures trading] - [Crypto Academy Trading Competition-S6W6] Team Trading Contest Post for Fredquantum-Kouba01 Traders Team - S6T4m

This is a repost for the following post link below


Hello fam, you are welcome to my first trading task for this week. This week I will be trading with the Fredquantum-Kouba01 Traders Team. On this trade I will be working with the CRVUSDT trading pair for a long position after carrying out technical analysis on the pair via Tradingview platform.


The Curve DAO token is the governance token of DEX for stables which uses AMM in managing liquidity. The Curve DAO was launched in second half of 2020 with the CRV token as the native token for governance.
The functionality of the Curve DAO is to use the Ethereum based tool (Aragon) to enable the connection of multiple smart contracts. These smart contracts can now be used to provide liquidity.
Based on commitment and length of ownership, the CRV token is rewarded to holders for providing liquidity. More credibility and longevity is given to the Curve token as many users provide huge liquidity on assets earning the CRV token as rewards. Yield farming and liquidity mining has brought a lot to the table for the CRV token.
This project was founded by Micheal Egorov (CEO of Curve) who is known to be an experienced person with cryptocurrency related enterprises. Egorov in 2015 co-founded NuCypher and also is the founder of Decentralized Bank and Loans network (LoanCoin).
The CRV token can be traded on the following CEX: Binance, OKEx, and Huobi Global.


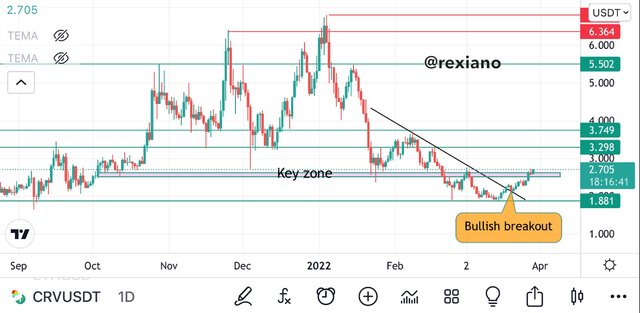
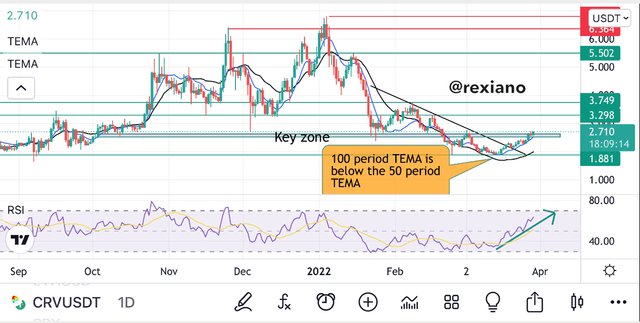
Looking at the 1D timeframe, the CRV token against USD tether shows a positive move to the upside as it breaks a key resistance zone after a bullish breakout has been experienced for some few days away from the downtrend line. The Monday candlestick broke through the key zone indicating a strong bullish momentum and this is confirmed by the RSI indicator. The RSI crosses the zero level and heads for the overbought region. At the moment the RSI was seen heading to the 60 level which is a positive move for opening long positions. The TEMA indicators also confirm the bullish move as the smaller TEMA is seen to be above the larger period TRMA. This can be seen on the price chart analysis below.


After noticing this activity on the 1D price chart of this token, I became interested in trading the cryptocurrency pair so I moved to a smaller timeframe to analysis the price chart.


I analyzed the CRVUSDT price chart for a 15 minutes timeframe using the double TEMA indicator strategy and confirming my signals using the RSI indicator as a filter indicator for this strategy.
This strategy goes does, when the smaller period TEMA crosses above the larger period TEMA, I have a possible bullish opportunity and when the smaller TEMA line crosses below the larger TEMA I have a bearish opportunity. To avoid false signals I will use the RSI indicator to filter out the noise of the TEMA lines crossing each other.
If my TEMA crossing implies a bullish opportunity I will make sure that the RSI confirms this by coming from the oversold region and the reverse is true for a bearish signal.
From the 15 minutes chart below we can see how the RSI moved into the lower zone indicating a retracement that will bounce back upward into the oversold (bullish) area. At this point the TEMAs where showing a bearish move on the 15 minutes chart but still maintaining a bullish move on the 30 minutes chart and the 5 minutes chart. I had to take the entry for a long position but with a short size.

The exit criteria is such that the stop loss (SL) is set just below the previous low and the take profit (TP) set at the max high but I took profit at exactly 1:2 risk reward ratio not waiting for the max price above.

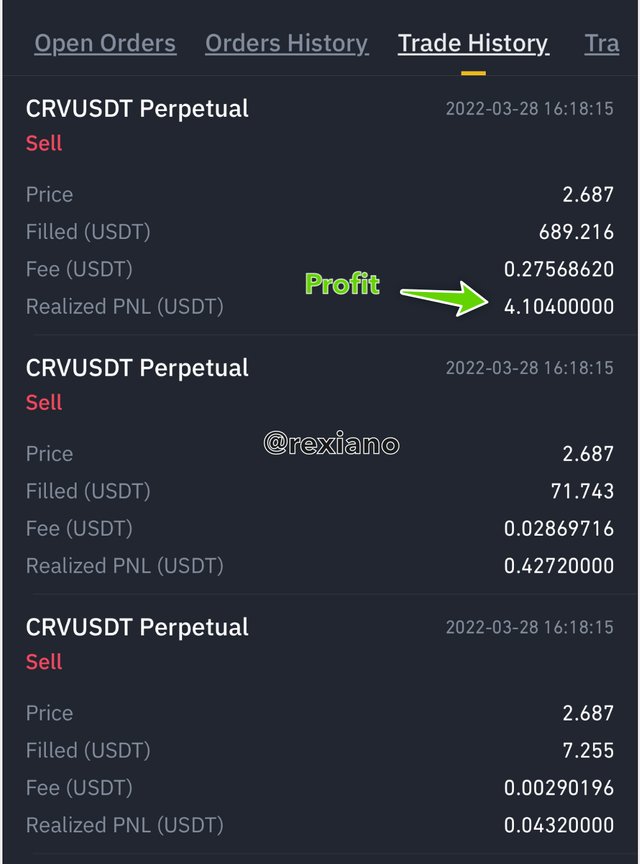
We can see how I made a $4.109 profit when my target was hit from the above screenshot from my Binance account on trading history from futures.


This trading exercise was done for a futures trade but nonetheless, the analysis proved that one can buy and hold the CRV token for a target at $5.502 in the short term is the price breaks the upcoming resistance.


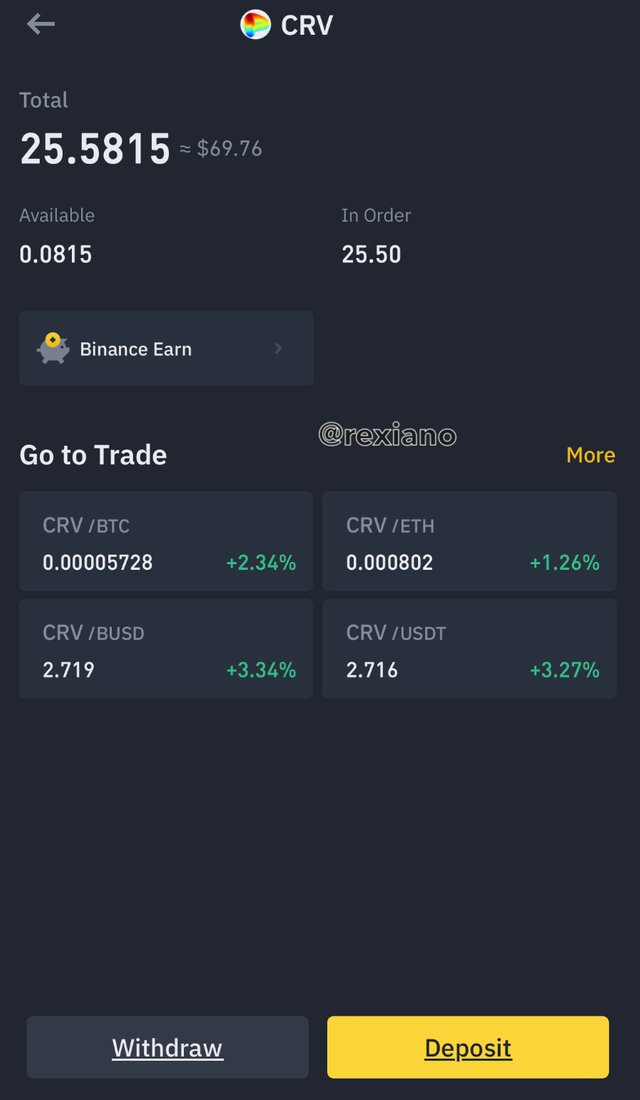
The CRV token is a good buy for the moment of holding maybe for a week or two provided the trader is watching the market closely. I think this can be a profitable short term hold token for spot traders. Currently I’m holding 25.58 CRV for the short term.

The above screenshot shows my holdings of this token for the short term provided the token continues to trade into the north I will continue to hold and further set SL in the profit zone as price moves upward.


From the larger timeframe analysis of this token to the utility, I can conclude that the CRV token is a good buy for any trader. Looking at the bullish confirmation from the different timeframes is a credited advantage for opening a long position at good entry points for both futures and spot traders wishing the week.
Thanks for reading and have a good trading week.