Trading Strategy RSI + ICHIMOKU CLOUD - Steemit Crypto Academy |S6W2| - Homework Post for Professor @abdu.navi03
In this assignment, we are asked to explain a trading strategy using the Ichimoku and RSI indicators. I am no stranger to the use of these two indicators, but I must admit that I learned some new knowledge from how to use these two indicators. This is a classy homework and is really useful for all of us.

1. My Understanding of RSI and Ichimoku Strategy
There are many indicators that can be used to perform technical analysis of a security, especially cryptocurrency, people may be very familiar with the RSI indicator, moving average, alligator, Ichimoku, BB, and many others.
Most traders also prefer to combine several indicators at once in carrying out technical analysis, this aims to minimize the occurrence of errors in making trading decisions such as false signals, etc.
In this task, we will combine the RSI indicator with the Ichimoku in carrying out technical analysis in order to make the right trading decisions. All indicators have their own advantages and disadvantages, so the option to combine two indicators at once is the right step to filter out false signals or late signals.
Combining the RSI with the Ichimoku is necessary, because the RSI is a momentum-based indicator that works by measuring price momentum (overbought and oversold), so this indicator does not work too well in a trending market. We will be faced with many false signals from the RSI indicator if we use it in a trending market, we can say that the RSI is one of the best indicators that can be used in a range market, but we know that the market is not always in a range.
While the Ichimoku indicator is a trend-based indicator, this indicator works by providing uptrend or downtrend signals so that we can read the direction of price movements. In addition, Ichimoku can also show traders dynamic support and resistance levels, this is certainly a plus for Ichimoku that we can't get in RSI.
However, Ichimoku has its own weakness because it is a little late in giving signals, we can only really get a signal from Ichimoku after the price moves through the Ichimoku cloud (down or up). So that the combination of these two indicators is a perfect thing which we will discuss soon below.
2. Disadvantages of RSI and Ichimoku when working individually
- The time parameters of the RSI indicator are different, and the results will be different.
Different investors have different personal preferences for setting time periods. In theory, although the RSI indicator with a shorter period is more sensitive, it has faster shocks and is less reliable, the RSI indicator with a longer period is relatively sensitive. Although the signal is reliable, the indicator is less sensitive and the response is slow, so there is often a phenomenon of missing buying and selling opportunities.
In addition, because the RSI is calculated at the closing price, if the market volatility on the day is large and the upper and lower shadow lines are long, the RSI cannot accurately reflect current market changes.
- The indicator's passive phenomenon caused by overbought and oversold tends to send erroneous operating signals.
In the middle stages of a “bull market” and a “bear market”, it sometimes happens that the value of the RSI rises above 90 or falls below 10. At this time, unclear and misleading information will appear after the indicator is passed off. For this indicator, it may appear Made a mistake, missed a profit opportunity or got stuck in the market early.
- The trend "deviation" between the RSI indicator and the stock price is often lagging.
On the one hand, the market situation has reversed, but the signal “deviation” of the indicators may appear with a pause, on the other hand, under the influence of various random factors, sometimes the phenomenon of “deviation” occurs several times before the market actually begins to reverse. similarly, when assessing the phenomenon of "deviation" of the indicator, the number of "deviations" corresponding to a real reversal cannot be concluded. One, two or three deviations may have a trend change, which is difficult to confirm in actual operation.
- If the value of the RSI indicator fluctuates around the 50 level, the RSI often loses its reference value.
In general, RSI values between 40 and 60 are not very useful. According to the principle of applying the RSI, if the RSI breaks above the 50 dividing line from below 50 it means that the security price has reversed up, if the RSI drops from above 50 to fall below the 50 dividing line, it means that the security price has weakened. But the actual situation often confuses investors, because the price of securities often changes from strong to weak but not falling, and from weak to strong but not rising. This is because under normal circumstances, the RSI will be the first to complete consolidation and become stronger or weaker when the broader market or individual securities is in an uncertain direction and consolidates.
- The Ichimoku indicator is based on lagging data.
Traders looking for a more predictive approach may find themselves frustrated with the lagging signals provided by Ichimoku Cloud. Since it is based on moving average data, this limitation is unavoidable and can be a big hurdle for some traders.
- Rich data and line graphs are not always useful.
While it's good to have a lot of information on one chart, busy charts can actually interfere with our ability to evaluate trades. This problem can be solved by adjusting the indicator and removing unnecessary lines, but this adds an extra step that slows down the analysis.
- For traders who focus on longer trading time frames, trends can lose relevance.
Moving averages work well for daily and intraday trading, but the moving average time frame used in Ichimoku Cloud does not cater to traders as they can only hold long positions for months at a time. Longer moving averages and/or other technical indicators can be used in addition to or in place of the Ichimoku Cloud.
- Unable to identify the start of a confusing trend and sideways market
Honestly, Ichimoku was not able to identify the start of a new trend on time, this is a loss for traders not being able to enter the market on time. In addition, Ichimoku also really sucks if it is in a sideways market, sometimes the price moves above or below the Ichimoku cloud, but there is no real trend.
3. Trend Identification Using RSI And Ichimoku Strategy
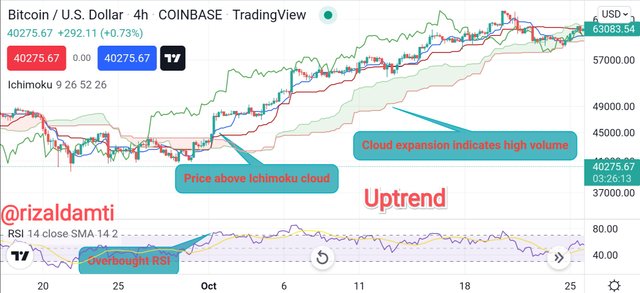
We know that the RSI is a momentum indicator, so we can understand that when a security's price is above 70, it is an uptrend. The RSI only shows the price is above the 70 level despite the strong buying pressure, the price will only be in the overbought area, as the RSI is unable to reveal the high buying volume that could push the price higher.
That's why we combine RSI with Ichimoku, because Ichimoku is able to show trading volume. As we know that, if the price breaks above the Ichimoku cloud then this is an uptrend signal. The expansion of the cloud indicates a high volume of demand in the market, the farther away the cloud is with the price the stronger the trend is going on.
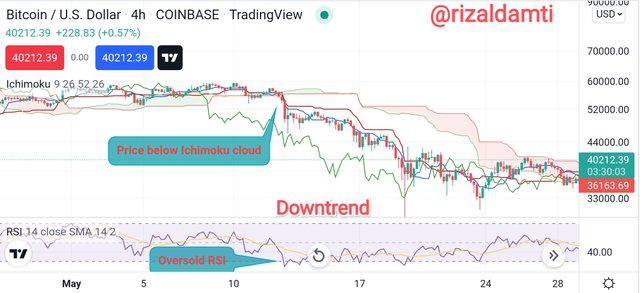
Likewise in a downtrend market, the RSI will mark it by being below the 30 level which is the oversold area of the RSI. To see how strong the ongoing selling pressure is, we must use Ichimoku. When the price is below the Ichimoku cloud, this indicates a downtrend and the larger the cloud indicates high sales volume, the more distant the cloud and price action, the more bearish the market is.
4. Using MA with RSI And Ichimoku Strategy And a Good Length
When viewed from its basic form, we can see that in fact the two Ichimoku lines, which are blue and red, have the same use as Moving Averages for periods 9 and 26. However, the plotting method is not exactly the same as the MA.
MA is plotted by adding up all Close points in the agreed period, then averaged. While the Ichimoku lines are plotted only by dividing in half between the highest and lowest points of the price. Because the way of using the Ichimoku line is almost the same as the way of using the MA, the two lines can function as a Trend Indicator like the MA.
The purpose of adding MA is of course to increase efficiency and filter out false signals. For the MA period, we can set it according to our needs such as 50, 100, and 200. But this time we will use the 85 period for the MA because this is a good period to use if we combine it with the RSI + Ichimoku strategy.
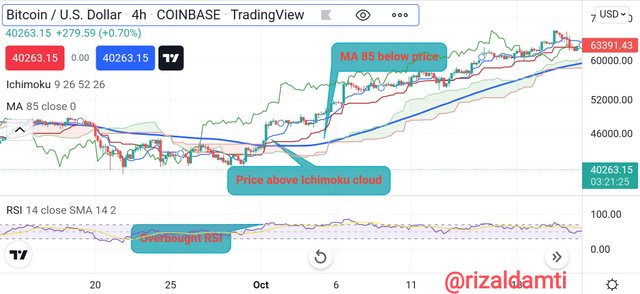
Look at the chart above, as we know that if the MA line moves below the price, this is an uptrend signal. In the chart above the price is above the Ichimoku which is an uptrend signal, the MA clearly confirms the uptrend signal by moving below the price.
5. Level Support And Resistancet With This Strategy
As we know that the support and resistance levels in the chart are very useful for traders. support and resistance levels act as their name implies. The support level will support the price from below like a foundation that serves as a strong support to rise. Whereas the resistance level limits the upside potential by testing the strength of the uptrend in the market, thus, from above the resistance holds the bullish movement.
Ichimoku support and resistance levels in uptrend and downtrend markets
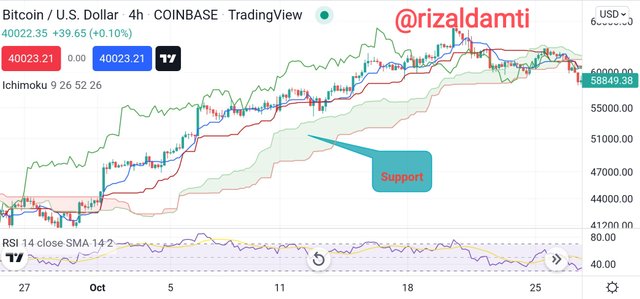
If the price moves above the Ichimoku cloud, it means the price is in an Uptrend. And the cloud from Ichimoku that is below the price will be the Support area of the price movement, it will be green.
You need to know that, the farther the cloud is from the price, the stronger the signal for the ongoing trend. However, if the price has started to climb the cloud, then this is a sign that the trend is starting to weaken.
Vice versa. If it turns out that the price is below the Ichimoku, then the trend is in a downward movement. The cloud above the price will become a resistance area, it will be red.
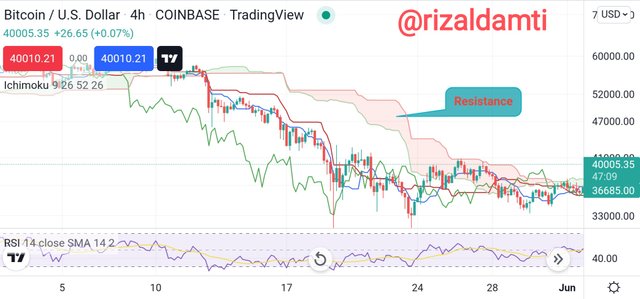
One more thing, if the price is in the cloud, it means that the price is entering a period of struggling and the up or down trend is unknown, or it could also be called a Sideways condition.
RSI acting in a sideways market
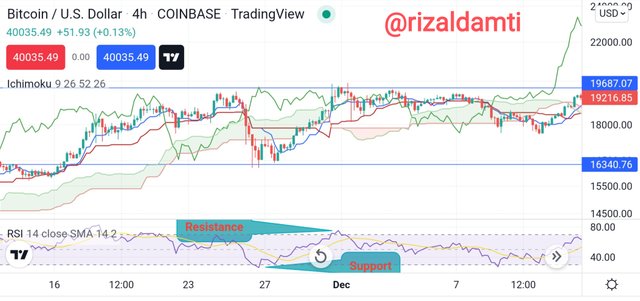
Since the Ichimoku is a trend-based indicator, the performance of this indicator is not very good in the range market. So we have to take advantage of the RSI to detect support and resistance levels in the sideways market.
The overbought and oversold levels in the RSI will become support and resistance levels in the sideways market, so when the price touches the overbought line on the RSI, the price will bounce down because this serves as resistance. Vice versa, when the price touches the oversold line, the price will bounce back up because the oversold line serves as a support level.
6. Can This Strategy be a Good Strategy for Intraday Traders?
In my personal opinion, this strategy can be used on Intraday trading. I don't see any limitations to this strategy, so in my personal opinion it can be used on all types of trades as well as on different timeframes. It all comes back to the trader, if he can really understand these two indicators then I believe he will be successful with all types of trades.
Because this strategy can be useful in a trending market or a trend that is just starting, it can even be used to spot trend reversals. So the Intraday trader can take advantage of this strategy to find entry and exit points, especially if he adds moving averages. Because the moving average can be a filter for false signals and to increase the efficiency of the signal generated by Ichimoku. Back to the basics, it all depends on the traders themselves, because we are not always going to be successful, so it's a good idea to research as well as possible before entering the market.
7. Demo Trading To Buy And Sell Using This Strategy
I will be using this strategy to make buy and sell trades using a demo account from TradingView, this is how it turns out.
Demo Trade for Buy XRP/USDT
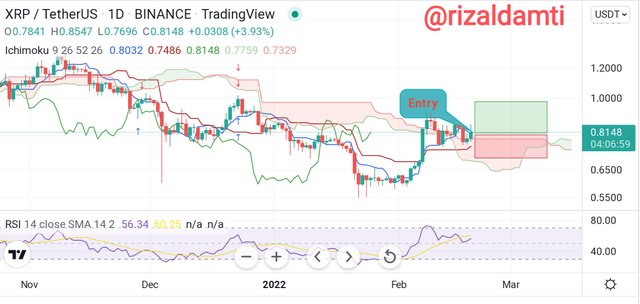
I looked at the XRP/USDT chart and saw the signals this strategy generates. The price has broken through the Ichimoku cloud, but the price is still around the cloud, then there is a slight increase with a bullish candle that looks to be moving away from the Ichimoku cloud. The RSI is also still in the overbought level, namely at the level of 80. I immediately placed a buy order. My stop loss is placed under the cloud with a risk-reward ratio of 1:1.
Demo Trade for Sell AVAX/USDT
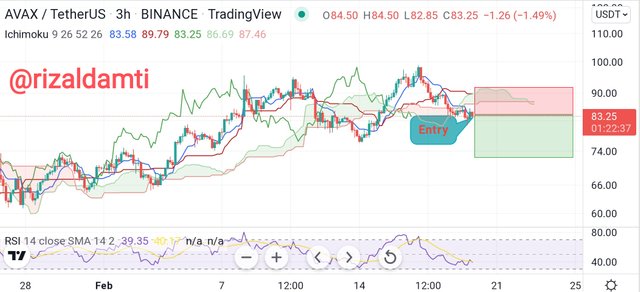
My sell trade was on the AVAX cryptocurrency, because when I looked at the AVAX chart, it happened that the price just dropped below the Ichimoku cloud. In addition, the RSI is also at the level of 30 which indicates strong selling pressure. I immediately placed a sell order, this time I placed a stop loss just above the cloud which acts as a resistance level.
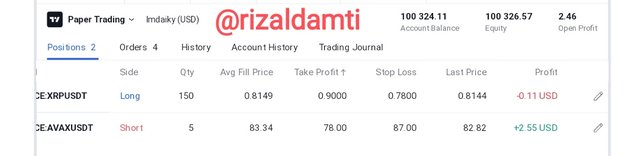
Proof of trades that I have made
Conclusion
Each indicator has its own advantages and disadvantages, so we must be wiser in using it. Like combining several indicators at once to get better trading signals, although this does not guarantee the trade will be 100% successful, at least we have tried our best to analyze the security before we enter the market.
The Ichimoku and RSI strategies are also really useful strategies that can be used on different types of trades as well as different time frames. Ichimoku and RSI complement each other in covering the weaknesses of each indicator. RSI as a momentum indicator and Ichimoku as a trend indicator.
Hello @rizaldamti
I will like you to join our curator team to apply for the up coming month of March.
We seek to gather club100 and club75 only and will like you to be part
Yes sure.
It was easy to understand thanks https://9blz.com/rsi-indicator-explained/