Perfect Entry Strategy using Stochastic Oscillator + 200 Simple Moving Average || Crypto Academy S5W3 || Homework Post For Professor @lenonmc21 || BY @saarah
Greetings to Everyone
Hope you all are fine and in good health!
Today i am going to participate in the Home Work Task of Season 5 Week 3 Which is "Perfect Entry Strategy" given by the Professor @lenonmc21 .
I am very excited to attempt this homework task and, I would like to say thanks to Professor @lenonmc21 on his remarkable efforts in Crypto Academy.
.png)

Question# 1
State in your own words what you understand about the Perfect Entry Strategy (Place at least 2 examples on crypto assets)?
In my point of view a perfect entry strategy comprises of understanding the price action compare it with an indicator and standard market structure to find the right time to take a trade.
According to professor we need to take three measures in order to find the best placement our order this including understanding the price action by the market structure and 200 moving average, compare the price action and see the harmony in the market structure and then confirm trend reversals by using the stochastic oscillator.
In order to define the trend, we see if it is making higher highs or lower highs. In a bullish trend the market structure shows higher highs and higher lows in a bullish trend the market structure shows lower highs and lower lows. This is further confirmed with the 200 moving average. If the 200 line is above the price action the trend is more likely to shift towards a bearish trend and if it is below the price action than the trend remains bullish.
An important aspect that indicates change in the trend is the interaction between the price action and the 200 lines. It is what type of patterns and candles are form when the price is trading close to the 200 lines. A trigger candle is a short-bodied candle with absorption wicks that indicate the current trend is losing strength and thus a new trend may begin.
This reversal is confirmed by the stochastic oscillator. It consists of two lines that oscillate between 0 and 100. The two important ranges in the indicator are 0 to 20 which indicate an oversold condition and 80 to 100 which indicate an overbought condition. The price after trading in the overbought region reverses back down towards a down trend and the price after oscillating in the oversold condition reverses to the top to form and uptrend.
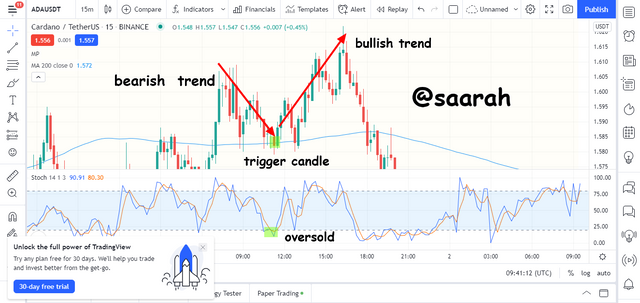
In the ADA/USDT chart below we see an example of the perfect trade entry.
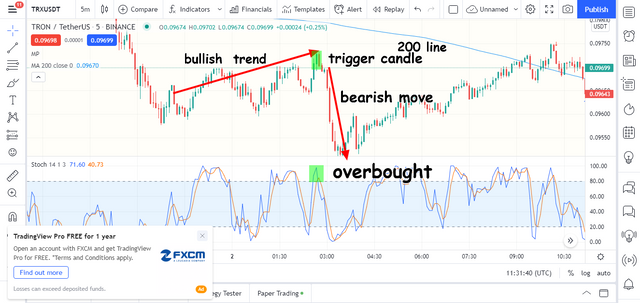
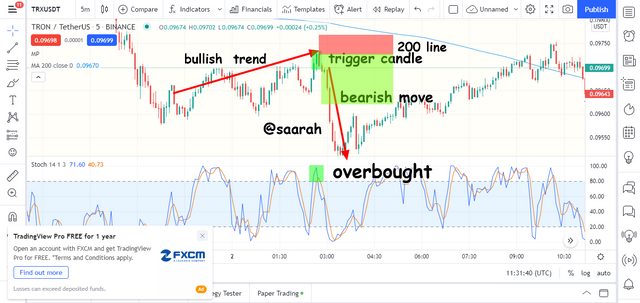
Then again in the TRX/USDT we see an ideal entry pattern, with price trading below the200 line which is acting as a support, the price makes higher highs indicating uptrend and then a trigger candles represent a decline in the strength of the trend which is confirmed by the overbought stochastic signal.

Question# 2
Explain in your own words what candlestick pattern we should expect to execute a market entry using the Perfect Entry Strategy?
The length of the body of a candle is often the signal of the strength of the trend. Often at the end of the trend we see candles that have short bodies or no with very small bodies and longer wicks such candles are termed as the trigger candles and according to the professor these candles are very important in indicating that a trend is losing strength.
When they are formed at the end of an uptrend, we know that a bearish reversal can be expected so they can be identified as the right point of market to place buying order and if they are formed at the end of a bearish trend, they are indication of the point to place a buy order since the bearish trend is losing strength.
Question# 3
Explain the trading entry and exit criteria for buy and sell positions in any cryptocurrency of your choice (Share your own screenshots)?
For perfect trading strategy you must see that the price should be trading either above or below the 200-line indicating the presence of an actual trend. Thus, the market should not be in the consolidation phase. All the above points including a harmonious market structure, the position of the 200 line and the stochastic oscillator should be suggesting the same result. The stop loss should be placed closer to the trigger candle and the take profit should be around the 20 or 80 level which makes it around 1:2 or 1:3.
Buy order
- The price was trading above the 200 lines
- A bearish trend is with the formation of lower highs and lows
- A trigger candle formation near the 200-line indicating the weakness of the bearish trend
- The buy signal was then placed seeing that the stochastic indicator is in oversold condition
- The stop loss was set close to the trigger candle and the take profit was set around the 80 level
Sell order
- The price was trading below the 200-line
- A bullish trend is with the formation for higher highs and higher lows
- A trigger candle formation near the 200-line indicating the weakness of the bullish trend
- The sell signal was then placed seeing that the stochastic indicator is in overbought condition
- The stop loss was set close to the trigger candle and the take profit was set around the 20 level
Question# 4
Trade 2 demo account trades using the “Perfect Entry” strategy for both a “Bullish” and “Bearish” scenario. Please use a shorter period of time to execute your entries. Important you must run your entries in a demo account to be properly evaluated?
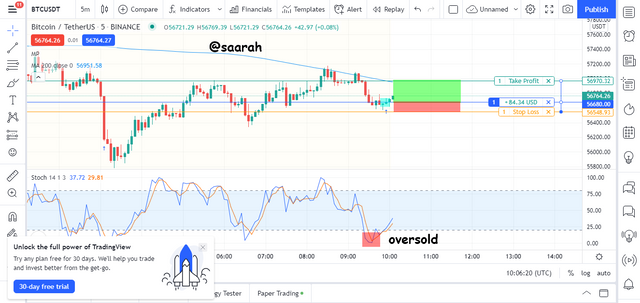
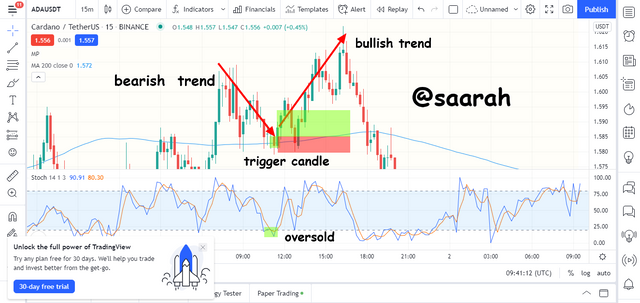
- Although the price was trading below the 200-line the stochastic and candlestick pattern were suggestive of the bullish trend
- A bearish trend could be seen previously
- A trigger candle formation near the 200-line indicating the weakness of the bearish trend
- The buy signal was then placed seeing that the stochastic indicator is in oversold condition
- The stop loss was set close to the trigger candle and the take profit was set around the 80 level
Sell order
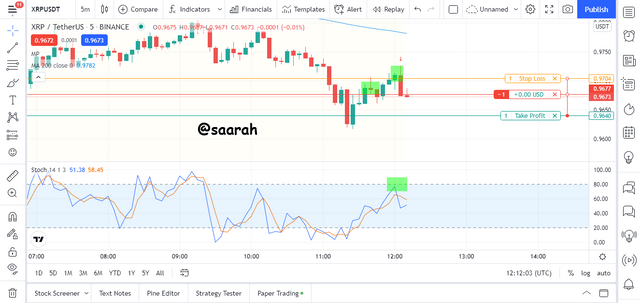
- The price was trading below the 200-line
- A bullish trend is with the formation for higher highs and higher lows
- A trigger candle formation near the 200-line indicating the weakness of the bullish trend
- The sell signal was then placed seeing that the stochastic indicator is near the overbought condition
- The stop loss was set close to the trigger candle and the take profit was set around the 20 level
Conclusion:
A perfect trading strategy may differ for different traders but the components remain the same that include understanding the relationship between the price action and different indictors. Here we used the stochastic to identify overbought and oversold reigns, moving average to confirm the trend and the trigger candle to place the entry signal at the right place.
Note :
All the images of the have been taken from the tradingview.com
CC:
@lenonmc21
My Transferred History #club5050