[CRYPTO TRADING STRATEGY WITH MEDIAN INDICATOR] || Crypto Academy / S6W4 || Homework Post for @abdu.navi03 || By @salmanwains
This is Season 6 Week 4 of Steemit Crypto Academy and I'm writing homework task about "CRYPTO TRADING STRATEGY WITH MEDIAN INDICATOR" assigned by Professor @abdu.navi03 .
.png)

Question# 1
Explain your understanding with the median indicator?
Indicators are commonly used in the charts for rightful assessment and prediction of the trend. they can also be used to understand the momentum and oversold and overbought zones. One such indicator that is commonly used is a trend-based technical indicator called the median indicator.
It helps in the identification of market direction, its sentiments and volatility. Visually it appears as a tunnel that is constructed from the ATR value from the median line. the ATR line is plotted above and below the median line from which volatility can be assed. The mechanism behind this is that the ATR is compared to the similar length of EMA which forms a cloud and thus helps in trend identification.
Normally the bullish cloud is green and the bearish cloud is purple.

Question# 2
Parameters and Calculations of Median indicator. (Screenshot required)?
The median indicator consists of ATR and multiplication factor that is used to plot a line above or below the median line.
Calculation
These can be summarized as:
Median value = Highest price + lowest price / 2
EMA Value = Closing price x multiplier + EMA (previous day) x (1-multiplier)
Additionally
Median length = period of observation
Upper band = Median length + (2ATR)
Lower band = Median length - (2ATR)
Parameters
These parameters can be appreciated when you add the median indicator in the chart on a platform like tradingview.com and click on the settings tab as shown below.
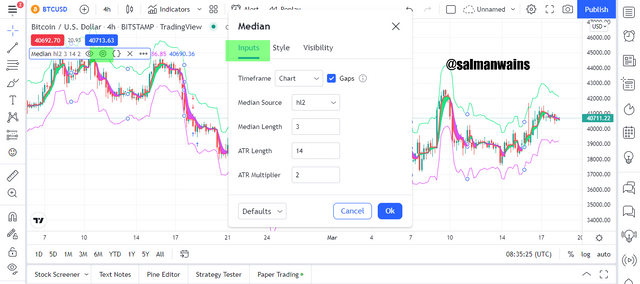
In the screenshot above we can see that the Median length by default is 3, the ATR length by default is 14 and the ATR multiplier is 2. In addition to the above the colors and representation of the parameters can be changed.
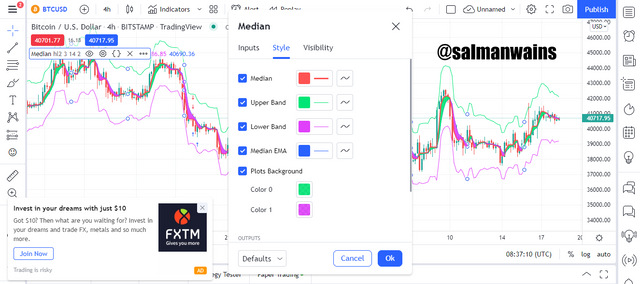
By default, the median line is red. The upper band is green, the lower band is purple and the median EMA is blue.
Question# 3
Uptrend from Median indicator (screenshot required)?
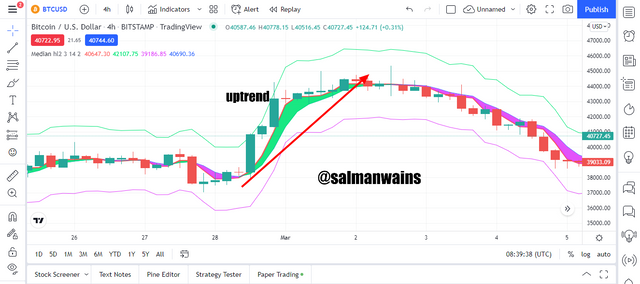
Above we have in the BTC/USDT chart an uptrend using the median indicator.
The most prominent feature is the color coding which for uptrend by default is green. During an uptrend the median value is higher than the EMA value. This can only be possible when buyers are in control of the market and the bullish trend is prevailing.
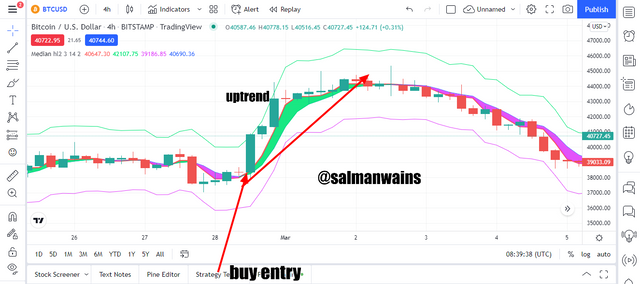
A good buying entry is considered when the cloud turns green and the price action breaks the median line to go above it. Using the above chart we can place a buy entry around the point where the price broke the EMA.
Question# 4
Downtrend from Median Indicator (screenshot required)?
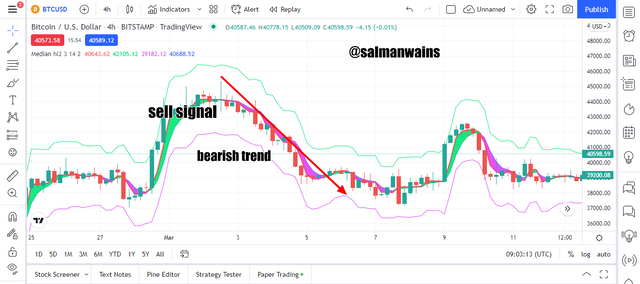
Much like the uptrend the downtrend can be identified using the position of the price action and color coding of the median cloud.
When the sellers take over the market and there is a bearish trend the color code of the median cloud changes too purple. At this time one can appreciate that the EMA value is higher than the median value and that results in the cloud color changed to purple.
Investors can utilize this opportunity to place short orders as soon as the purple color appears. During this time ideally the price action may be trading below the EMA and the point where it crosses the EMA to move below can be used to place a sell signal.
Question# 5
Identifying fake Signals with Median indicator(screenshot required)?
It is always advised to use a combination of indicators when trading. It increases the accuracy of trade and deceases the chances of jumping on false signals. A combination of indicators also helps in understanding more dynamics of the market than a single indicator alone can display.
Similarly in order to filter false signals with median indicator we can pair up RSI. It is a momentum-based indicator and helps in the identification of the overbought and oversold regions. The reading below the 30 line indicates an oversold condition and a bullish reversal can be expected on the contrary cross above the 70 line indicates an overbought condition, thus a bearish trend reversal can be expected.
Thus we use the indications of trends from both the indicators and any divergence between both would hint a false signal. On the contrary if both the indicators agree with the trend it will be considered a strong trend.
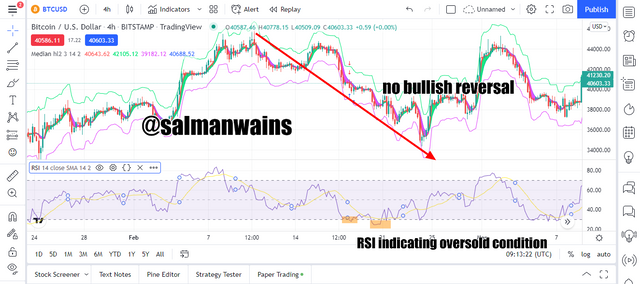
In the above chart we see that the RSI indicated an oversold condition which according to ideal conditions predicted a bullish reversal. The median indicator on the other hand continued showing a bearish trend in the form of a purple cloud. This confirmed that RSI was giving a false signal hence the combination of the two indicators helped in identifying the false bullish signal.
Question# 6
Open two demo trades, long and short, with the help of a median indicator or combination that includes a median indicator (screenshot required)?
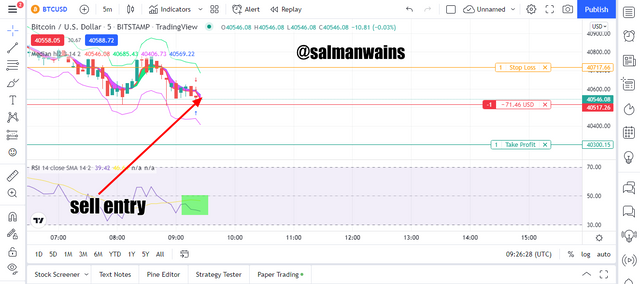
Sell Trade
The median cloud was in purple color. The price was trading below the EMA line and the I checked the RSI the RSI line as trading below 50 indicating that the down trend was strong. I executed the sell order. The trade in the start went in loss. I placed adequate stop loss and take profit. The stop loss was around the previous high and the take profit was set below the lower band.
Buy Entry
The median cloud was in green color. The price was trading above the EMA line and the I checked the RSI the RSI line was trading around 50 indicating that the uptrend could be strong I still took the risk. I executed the sell order. The trade in the start went in loss. I placed adequate stop loss and take profit. The stop loss was around the lower band and the take profit was set near the upper band.
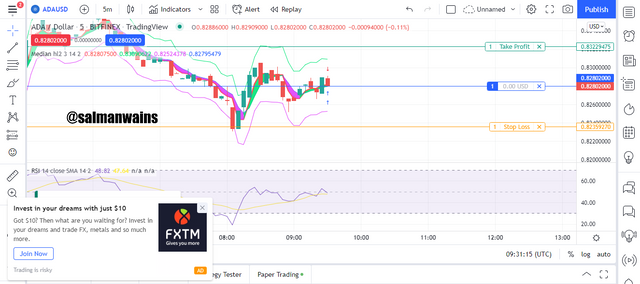
Initially the trade could be seen nor in profit nor in loss. I decided to hold the position until I get the desired results.
Conclusion:
Median line is trend indicator but it is a little different from many other trend-based indicators because it is the based on the ATR and the EMA movements. The signals that are generated using the median indicator are basically due to relative movements of the ATR and the EMA and are pin pointed using the color coding. The bullish trend is represented by the green cloud whereas the purple cloud represents the bearish trend.
Note :
All the Screenshots have been taken from the tradingview.com platform.
CC:
@abdu.navi03
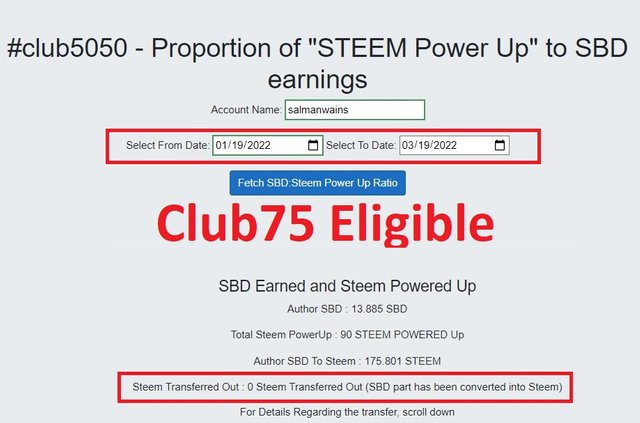
Club5050 Eligible
@tipu curate
Upvoted 👌 (Mana: 6/7) Get profit votes with @tipU :)