[Crypto Trading with Price Action] || Crypto Academy / S6W2 || Homework Post for @reminiscence01|| By @salmanwains
This is Season 6 Week 2 of Steemit Crypto Academy and I'm writing homework task about "Crypto Trading with Price Action" assigned by Professor @reminiscence01

Question# 1
Explain your understanding of price action?
Simply understanding price action is the movement and behavior of the price of an asset in the crypto market. A price action is generated by summarizing the market performance of an asset n terms of its price such as the closing price, opening price, high price, low price etc.
Price action then is used to understand the market direction and the various sentiments such as the buying and selling pressures and the transaction volume. It forms the basis of the trend direction and phases of support and resistance.
It is in shirt the graphical representation of the price of an asset. there are many ways of displaying price action such as the line charts, bar charts, and candle stick charts etc. The most commonly used representation however is Japanese candlestick.
The price action is calculated based on the historical movements of the price and represents the psychology of the traders. The price actions itself forms various patterns that help in the prediction of trend continuation and reversal such as the flag patterns, double tops and double bottoms etc.
Question# 2
What is the importance of price action? Will, you chose any other form of technical analysis apart from price action? Give reasons for your answer?
Price action holds a great importance in defining and designing a technical strategy for trading. It helps the traders take calculated and decisive steps in taking the leads in terms of entry and exit points.
Price action is very useful when it comes to understanding the overall market structure. The way how price action unveils after every rise and fall in the market pressure develops a trend and direction of the market.
Comparing price action with other indicators forms the basis of very successful technical trade strategies. With the help of price actions traders are able to predict reversals and predict future market movement.
Another important aspect of the price action is the formation of certain patterns which help in understanding the sentiments of the traders which are responsible for breaking and continuing a particular trend. these patterns help us understand where the bulk of traders are heading.
Without the price action the indicators cannot be compared to get ideal trade setups. By combining indicators and price action we see the current market trends and then identify if the indicator is lagging or giving false signals.
It is however to trade using a couple of analysis techniques and since the price action is a technical analysis tool, we should combine metrices for fundamental analysis too.
By combining fundamental analysis, we can evaluate the overall performance of an asset, its authenticity and demand.
Question# 3
Explain the Japanese candlestick chart and its importance in technical analysis. Would you prefer any other technical chart apart from the candlestick chart?
The Japanese candle stick pattern is a very popular price action chart pattern. Much like any other chart pattern it is also based on the supply and demand of the asset and each candle is calculated using the data of the recent candle stick. It takes into account four prices closing, opening, high and low.
The best part of the candlestick chart pattern is that it gives a detailed information of the price of an asset than the line chart. It is visually easier to understand since the color of the candle is particular to the trend.
By default, a green candle signifies a bullish trend and a bearish trend is signified by a red candle. The size of the candle and the wick also reveals a lot of information about the supply, demand, volume and strength of the trend.
These candlestick patterns signify support and resistance levels by forming lows and highs. The pattern oof the candle is very indicative of the trend changes at these moments for example an inverted hammer candle formed near a resistance signifies a bullish reversal. these candle stick patterns show price volatility and very sensitive to changes in the price.
Other chart patterns are less used but preferred by some traders based on their trading styles. For example beginners prefer line charts since they are very simple and noiseless. A line chart pattern is also preferred by long terms traders who is only concerned by the price direction and the volatility and fluctuations.
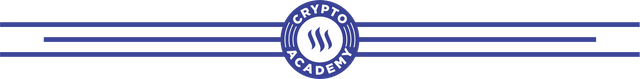
Since I usually trade short term, I prefer Japanese candlestick pattern for my trading. This is an illustration of a Japanese candlestick chart pattern.
Question# 4
What do you understand by multi-timeframe analysis? State the importance of multi-timeframe analysis?
In my view multi-frame analysis means analyzing a single-entry point in different time frames to take the most accurate entry. Analyzing an asset from different time-frames equip us with better knowledge about its current movement and behavior. Overall, the shorter time frames help us take a safe yet early entry and the longer time frames in understand the main trend of the asset.
Benefits of the Multi-Frame Technique
- It helps in better understanding of the current trend when the price action alone shows an indecisive stage or the pattern is very ambiguous.
- It helps in smoothening a pattern for example in longer time frames you may notice the market patterns fluctuating. too much and taking an entry seems dangerous thus switching between time-frames clear the noise and presents a better picture.
- It reveals more chart patterns when a market is seen from different time periods.
- Confirm the support and resistance levels and also in identification of correct support and resistance zones.
- Helps in seeing a clear trend and market direction.
- The best thing is the placement of tight stop loss placement and early entries.
Question# 5
With the aid of a crypto chart, explain how we can get a better entry position and tight stop loss using multi-timeframe analysis. You can use any timeframe of your choice?
Below we have a BTC/USDT chart let’s suppose we are a bit confuse whether the market will continue to go down or up. This is a 5 hours chart. The candle stick pattern is too clear to predict the next market move. So we switch to larger framework.
The daily time frame reveals that the trend is bullish and higher low can be appreciated. But we can also see that the candlestick rejected the resistance to go down and is heading close to the resistance again. Here if we draw the support and take a buy entry accordingly, we will have to set the stop loss to about 42000$.
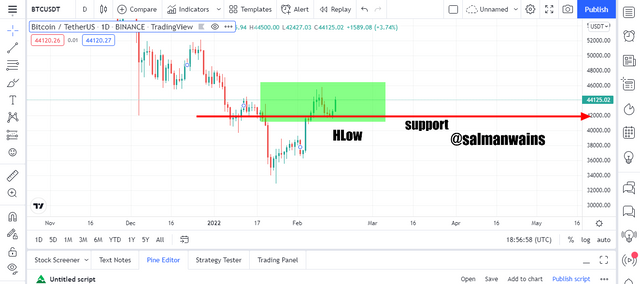
If we rely on this chart alone, we will have to wait until the price touches the resistance to see if we see an inverted hammer structure or the prices breaks the resistance on the contrary if we move to a shorter time frame like 15 mins, we will be able to take a good entry with a tight stop loss.
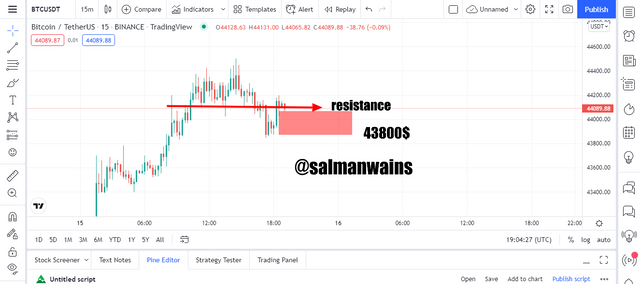
Now if we place the buy order using the 15 min chart we can place the stop loss at around 43800$ near to the recent low and thus can loss less.
Question# 6
Carry out a multi-timeframe analysis on any crypto pair identifying support and resistance levels. Execute a buy or sell order using any demo account. (Explain your entry and exit strategies. Also, show proof of transaction)?
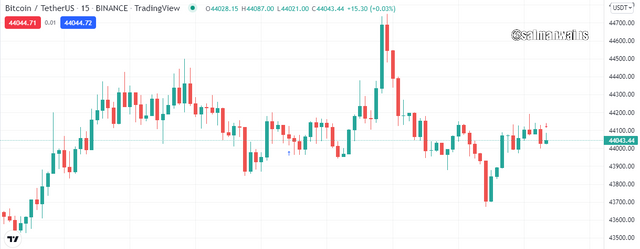
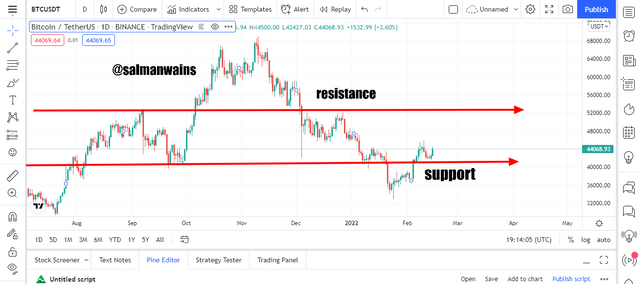
Again, in this question I will be using BTC/USDT chart as stated above. Below we have a 4-hour chart it is very unclear and noisy. To make a clear decision I will have to identify correct support and resistance levels.
For that I switched to a 1 day chart. This widens the scope in comparison to the 4 hour chart and helps in identification of clear support and resistance levels. This chart clearly reveals that the price has rejected the support and continue moving up.
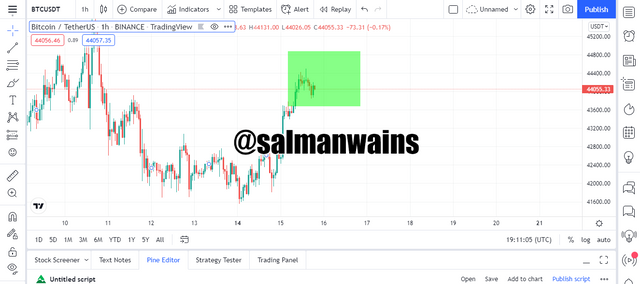
To take an accurate entry I switched to 1 hour chart. The stop loss was placed below the close to the MA which was acting as a support. I added MA to further strengthen the strategy.
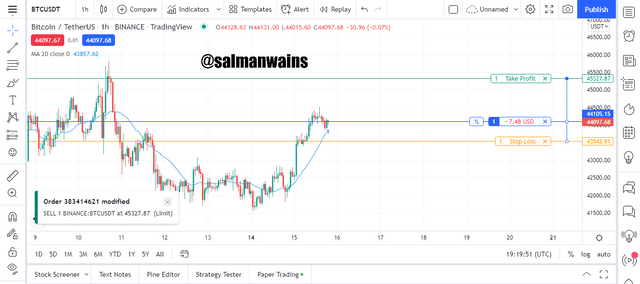
The buy order was placed as soon as the price rejected the MA and started to go above. The entry initial went in loss but I was sure that it will perform good.
Conclusion:
The price action shows the changes the price of an asset on the chart. It displays the trend, support and resistance zones and helps in understanding the market sentiment. The multiple time frame setup helps in better identification of the market trend and take trade entries based by reducing noise.
Note :
All the Screenshots have been taken from the tradingview.com platform.
CC:
@reminiscence01
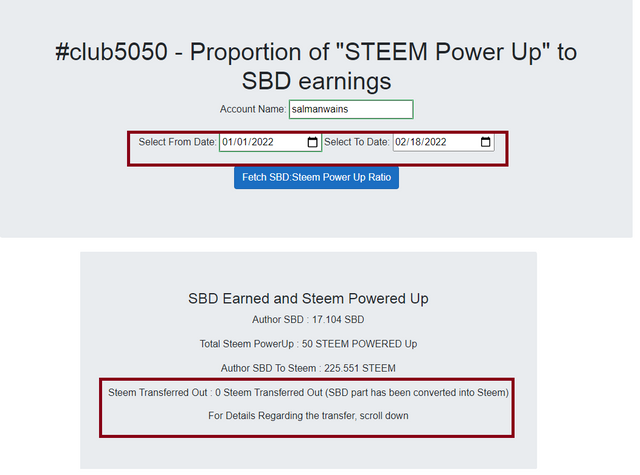
Club5050 Eligible
Hello @salmanwains , I’m glad you participated in the 2nd week Season 6 at the Steemit Crypto Academy. Your grades in this task are as follows:
Recommendation / Feedback:
Thank you for participating in this homework task.