Repost - Understanding Trends II - Crypto Academy || S5W3- Homework Post || For Professor @reminiscence01|| By @salmanwains

This is Season 5 Week 3 of Steemit Crypto Academy and I'm writing homework task about "Understanding Trends II" assigned by Professor @reminiscence01

Question# 1
a) Explain your Understanding of Trend Reversal. What is the benefit of identifying reversal patterns in the Market?
We know that the market of any asset is repetitive based on the price action that goes up and down. Trend reversals simply means a change of trend. For better understanding we can say that if when you entered the chart of any asset and it was trading higher and higher and then the trend began losing its momentum until the price drops and then starts down trending you experienced a trend reversal from bullish to bearish.
Understanding the trend reversals protect you from placing orders at the time when a trend is losing momentum. There are a lot trend reversal strategies that involve a timely prediction of trend reversal and then placing the right bids.
A good trader understands the importance of early detection of trend reversals. Especially if the market has been trending a particular direction lately it might be near to a trend reversal and you may not want to place bids at this time. There are a lot of indicators and chart patterns that help you predict trend reversals.
For example, in the BTC/USDT chart below we can see the price was trading up for some time, but then we can see bearish candles forming and the bears taking control we then say a gradual decline in the price. Any experience trader would never place at bid when the few bearish candles started forming, but soon a trend reversal was confirmed bear orders could be very profitable.

When buyers are in control of the market the market trends higher and higher and as soon as the sellers enter the market and begin to take momentum the trend shifts to the other side and we a bearish trend.

b) How can a fake reversal signal be avoided in the market? (Screenshot needed)?
Many times, we see fake reversals in the market and these can be dangerous as many traders rely on trend reversal patterns. To avoid fake reversals, you should always use a market strategy or indicator to compare the price change with the volume.
There are several ways including break of market, break of trendline, double top and double bottom formation, and divergences to predict trend reversals but no strategy can give us completely accurate results. Therefore, a conjunctive approach is always suggested. This may include combining an indicator with the chart pattern or using two chart patterns to confirm a reversal.
One such confirmatory indicator that tells about the trend strength and momentum, oversold and overbought regions is the RSI. From the oversold and overbought we can identify reversal more accurately. The RSI line oscillates between two extremes. When the RSI line crosses the 70 line, we can say that the asset is in overbought condition and there is a possibility that it may reverse any time soon. When the RSI crosses the 30 line the asset is said to be in oversold condition and there is a high probability that it will reverse upward after it.
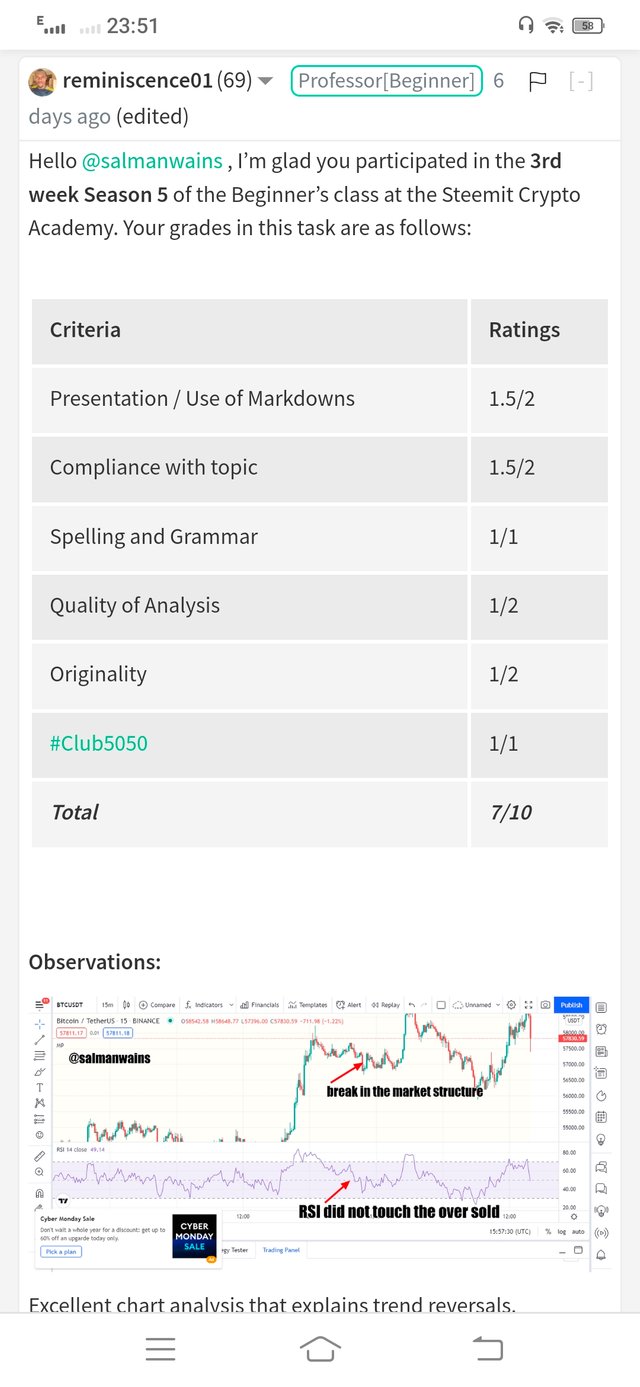
In the BTC/USDT chart below we can see that the trend was trading high then we saw a lower low and a break in the market structure but the trend did not reverse. The RSI confirmed that it was not an accurate trend reversal pattern as the RSI did not cross the 30 line.


Question# 2
Give a detailed explanation on the following Trend reversal identification and back up your explanation using the original chart. Do this for both bullish and bearish trends (Screenshots required)?
a) Break of Market Structure
In the previous assignments we understood how we have different market structures during uptrend and down trend. These market structures are itself an indication of trend continuation. During an uptrend we see the price line forming higher highs and higher lows while in a down trend the price forms lower highs and lower lows.
These market structures can also be used to indicate trend reversals if looked closely. For example, for a bullish trend to continue the next high should eb higher than the previous and the current low should be higher than the previous low. If this pattern fails to continue, we can expect a break.
This break indicates that buyers are losing control and that the trend is weakening. Thus, a reversal can be expected. In the BTC/USDT chart below we can see that how a lower low was formed after consecutive higher lows and higher lows and it was then followed by trend reversal.

Similarly in a continuing downtrend the next low should be lower than the previous and in case it is higher a break can be anticipated. This break means that sellers are losing control and that the buyers are entering the market. The down trending is weakening and a reversal can be expected. In the BTC/USDT chart we see that the bullish trend was exhausted once the price showed a higher low after making consecutive lower lows.


b) Break of Trendline
Trend lines are also drawn to indicate a continuous trend. A strong trendline meets two distinct points of a price action to indicate that the trend is valid. There are trend lines a down trending line to indicate a down trend and is drawn by combining two points acting as a resistance and an up trending line used to indicate an uptrend drawn by connecting two points acting as a support.
Price often oscillates around this trend line and only breaks it when there is a change in the trend and the previous trend is losing strength.
For example, in the BTC/USDT chart below we can see a trending line behaving as a dynamic support and you can see price respecting this level many times to finally cross this and indicating an opportunity of the trend reversal.

Similarly, in the BTC/USDT chart below we see a price line breaking the bearish trendline previously acting as a dynamic resistance. the price breaks it and the trend reverses to bullish.


c) Divergence
From the word it is pretty clear that we are talking about disagreement, but disagreement between what? Divergence simply means a disagreement between an indicator and a price action. Many technical indicators predict reversals on the basis of divergences. If the price is making higher highs while the indicator shows lower highs, we call it a disagreement.
In case of a bullish divergence the indicator shows lower lows and lower highs while the price is making higher highs. This indicates that the current bearish trend is on the verge of exhaustion and is weakening and a reversal can be predicted. This contradiction occur as the price is still trading low but the buyers are entering and try to take control.

In a bearish divergence while the price is making higher highs the indicator shows lower lows and lower highs. This indicates that bears are entering the market and the bullish trend is weakening. A bearish reversal thus can be predicted.


d) Double top and Double bottom
we often consider two lows and two tops to confirm the continuation or break of a trend. For a bullish trend to continue the next top is higher then the previous and for a bearish trend to continue the next bottom is higher than the previous. When the two tops or bottoms are formed at the same level this may indicate that the price tried to reach new level but could not get the strength. This may also indicate reversal.
The double top pattern is formed when the price tries to go higher than the previous level but the underlying buyers’ pressure does not support it. This can be a signal for a reversal and for it to be valid the second top must not be higher than the previous.

The two bottom structure is formed when the pries to go lower then the previous low but fails as the underlying seller’s pressure is decreasing and they are not able to take the price to the newer lows. This can be a signal for trend reversal and for it to be valid the closing price for the second top must not be less than the previous low. After a two bottom structure there is a high probability of bearish reversal.


Question# 3
3. place a demo trade using any crypto trading platform and enter a buy or sell position using any of the above-mentioned trend reversal/continuation pattern?
When I entered the market was trending bearish. A bearish trend line could be drawn joining a high and a lower high. The trend line could be taken as a dynamic resistance.
The price respected this resistance several times too finally break it. The price touched the dynamic resistance to move above it and once it crossed it and I could see some bullish candles forming I placed the buy order. The order was executed instantly.

The take profit and stop loss was set around in the ratio 1:2. I executed the trade by using my paper trading on tradingview.com.

Conclusion:
In this homework I was able to analyzed and understand the trend reversal and the importance identification of trend reversals. We analyzed different strategies such as the market break, trendline break and divergences etc. to understand how we can identify a reversal. This early reversal identifications to place buy and sell orders during the start of the trend to enjoy maximum benefit.

Note :
All the images of the have been taken from the tradingview.com
CC:
@reminiscence01

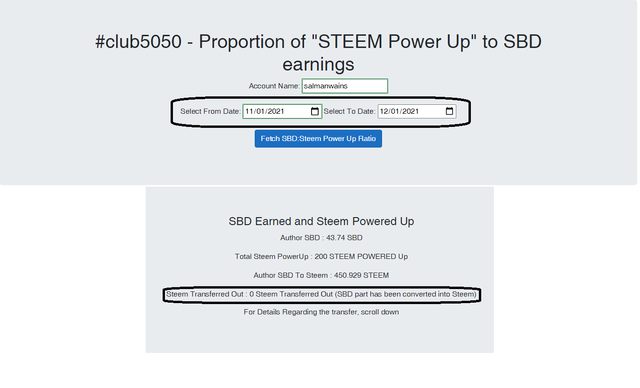
Club5050 Eligible

