[TRADING STRATEGY WITH RSI + ICHIMOKU] || Crypto Academy / S6W2 || Homework Post for @abdu.navi03 || By @salmanwains
This is Season 6 Week 2 of Steemit Crypto Academy and I'm writing homework task about "TRADING STRATEGY WITH RSI + ICHIMOKU" assigned by Professor @abdu.navi03


Question# 1
Put your understanding into words about the RSI+ichimoku strategy?
Traders often combine two indicators or more to find better trade setups. One of the indicators acts as a main indicator and the other acts as support for the confirmation of the setup. In addition to that one indicator can identify trend direction and other can signify trend strength or volume or mentum. One such pair is RSI+ichimoku.
RSI stands for Relative Index indicator it helps in the identification of overbought and oversold regions of the market. The most common levels is the upper 70 and the lower 30. When the RSI is above 70 it indicated an overbought zone and when the RSI is below 30 it indicates an oversold zone.
The overbought zone indicates that the price may experience a bearish trend anytime soon and the oversold region shows that the price may experience a bullish trend soon. The basic limitations of this indicator is that trading it with alone especially inside a trend is very difficult since it give no signals in addition to that it does not tell about the volume.
Ichimoku consists of two lines consists of Tenkan-Sen, Kijun-Sen, Senkou Span A, Senkou Span B and Chikoi Span. It is often use to place resistance, support levels. It also identifies the strength of the trend and momentum. When we combine these two we get an ideal trade setup. Their combination provides information about the trend reversals and thus traders can take early entries the entries can be confirmed using the position of the RSI.
As said earlier RSI cannot tell about volume and Ichimoku does so they together helps in avoiding false signals. As an oscillator RSI is very prone to false signals. But the divergences using the RSI and the ichimoku can be put to use.

Question# 2
Explain the flaws of RSI and Ichimoku cloud when worked individually?
Following are the Flaws of RSI when used alone
- The only signal it provides is of overbought and oversold region and nothing about direction particularly or volume.
- It is very prone to false signals as it is an oscillator.
- It is not an ideal indicator for scalpers because scalpers trade on short term frames. When you shorten period of the RSI it becomes too noisy and shows very much false signals since it is designed to give overbought and oversold signals after longer periods of time.
- It is basically a momentum indicator and not a direction indicator and will be of no use when the trend is identified.
Flaws of the Ichimoku Cloud
Ichimoku cloud is preferred by a large number of traders since it gives a lot of information about the market.
It can be used to identify tren direction, price breakouts, resistance and support levels.
The position of the two lines with respect to each other says allot about what is happening in the market. It has a few lacking's and limitations such as.
- In volatile market it lags behind the price action and by the time it shows the formation of the trend and trend is just about to exhaust and because of this the trader can miss early opportunities.
- As it is based on the average price so as it often behaves as a lagging indicator
Question# 3
Explain trend identification by using this strategy (screenshots are required)?
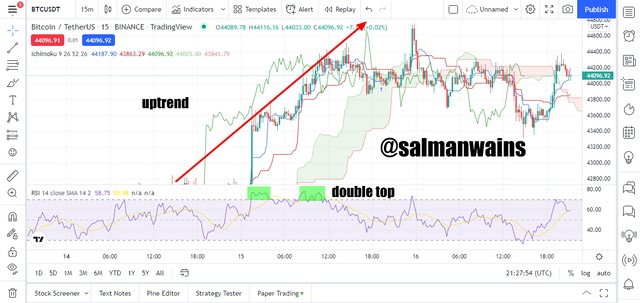
Bullish Trend
The following conditions should be fulfilled for the trend to be bullish according to this strategy.
- The RSI should be above 70 line.
- It should correctly slightly to go above the 70 line again and this will form the double top pattern near the overbought region.
- The Ichimoku cloud should be formed below the price during this time and the price should be trading higher and higher above it. As shown in the BTC/USDT chart below.
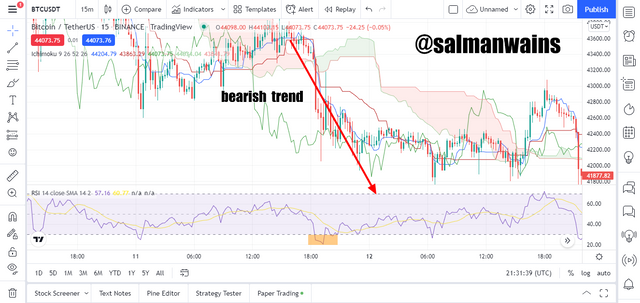
Bearish Trend
The following conditions should be fulfilled for the trend to be bullish according to this strategy.
- The RSI should be above 30 line
- It should correct slightly to go below the 30 line again and this will form the double bottom pattern near the oversold region
- The Ichimoku cloud should be formed above the price during this time and the price should be trading lower and lower below it
Question# 4
Explain the usage of MA with this strategy and what lengths can be good regarding this strategy (screenshots required)?
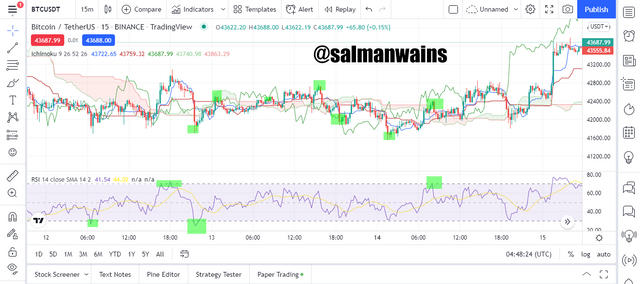
Several traders also use EMA or MA with this combination strategy. The use of MA is to further confirm the signals in addition to that as the cloud pattern can lack in several market structures the use of MA can to some extent cover that lag. The MAs serve to act as dynamic support and resistance levels.
The ideal lengths for the Mas to be used depend upon the trader’s preference and trading style however it is advised to use different lengths than the indicator. Most traders like to use a combination of 50 and 100 and I will demonstrate the same.
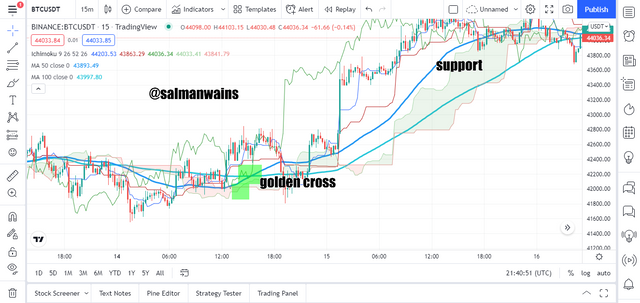
In the chart above we can see that the green cloud patterns and the golden crossover just occurred at the same time signifying that it is an accurate bullish reversal and buy entry can be taken here.
Question# 5
Explain support and resistancet with this strategy (screenshots required)?
Support and resistance are crucial to any trading strategy as they signify the areas of supply and demand.
A resistance zone is marked by the zone which the price rejects to continue moving down and a support is marked by the area which the price rejects to continue moving above.
These levels are difficult to break but when broken can predict strong reversals. The support can be seen as the floor of the market and resistance can be seen as the roof of the market.
In a trending market
while trading in the support and resistance levels in a trending market using RSI + Ichimoku strategy we need to look for the following conditions.
In case of support
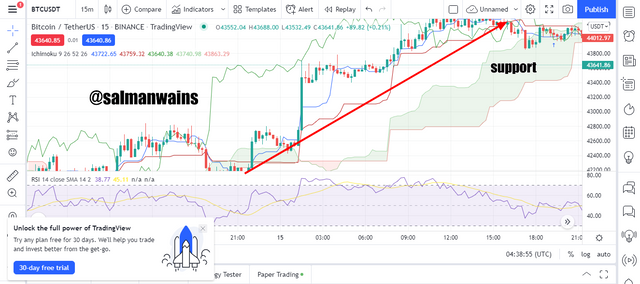
- Ichimoku cloud is below the price movement or price is trading above the cloud
- Its color should be green indicating a bullish trend
- The area between the price action line and the Ichimoku cloud indicates the strength of the support and the resistance.
The greater the distance the greater the strength. For example, in the BTC/USDT chart below Ichimoku cloud is acting as a support.
Resistance
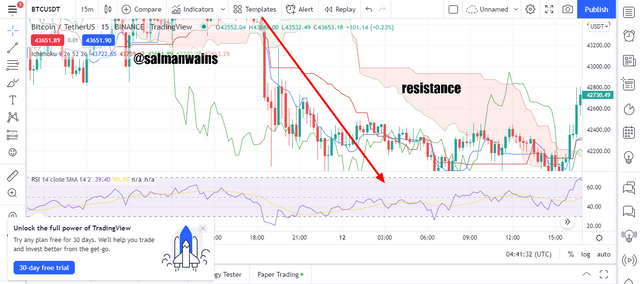
- Ichimoku cloud is above the price movement or the price is trading below the cloud
- Its color should be red indicating a bullish trend
- The area between the price action line and the Ichimoku cloud indicates the strength of the support and the resistance. The greater the distance the greater the strength. For example, in the BTC/USDT chart below Ichimoku cloud is acting as a resistance.
In the non-trending market
- In the sideways market The RSI must be touching the 30 line in case of the support and the 60 line in case of resistance.
** it will be showing oversold and overbought regions as shown in the hart below**
Question# 6
In your opinion, can this strategy be a good strategy for intraday traders?
In my opinion the combination of the two indicators can work well for intraday traders. Using each alone cannot be as effective as using the both. It is because intra intraday traders usually trade with in the main trend and as RSI only shows overbought and oversold conditions the efficacy of the indicator setup is greatly reduced.
When we combine the two indicators one covers the lacking if the other. For example, the cloud pattern tells us more than RSI in terms oof explaining the trend direction, trend strength, support and resistance levels and trading volume. While the RSI covers its major fault that is it lags in most cases. Using the RSI with it we can get early signals.
Using any combination of indicators surely depend upon the ease of a traders and its understanding to deal with the trend. the rule of the thumb is that no indicator is ideal and hence using 2 or more indicators together greatly reduces the chances of the errors.
Question# 7
Open two demo trades, one of buying and another one of selling, by using this strategy?
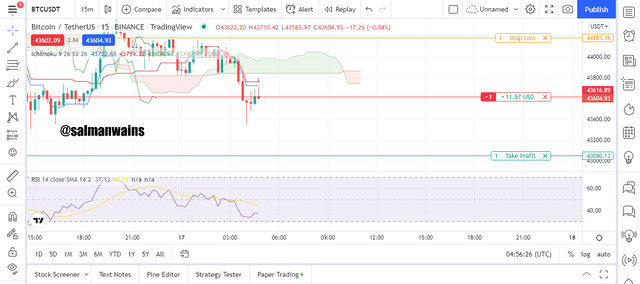
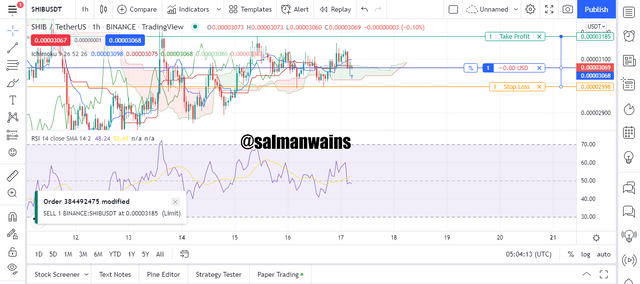
Sell Entry
in the BTC/USDT chart below we can see that the price was trading below the Ichimoku cloud the cloud had turned red and bearish candle was formed after a bullish candle. The RSI was trading below the 50-line showing that the downtrend is strong. I took the sell entry and the trade went well as seen. The stop loss and take profit levels were also sent around the previous high and low.
Buy Entry
in the BTC/USDT chart below we can see that the price was trading above the Ichimoku cloud the cloud was green and a bullish candle was seen forming. The RSI was trading above the 50-line showing that the uptrend can be strong. I took the buy entry and the trade was expected to perform well. The stop loss and take profit levels were also sent around the previous high and low.
Conclusion:
The combination of indicators is always preferred by the traders to find accurate trading signals. The RSI indicator indicates overbought and oversold signal and hence can predict potential trend reversals. In addition to that the cloud pattern can help us in identification of the trend direction and other important factors.
Note :
All the Screenshots have been taken from the tradingview.com platform.
CC:
@abdu.navi03
Club5050 Eligible