[Crypto Trading With Rate Of Change (ROC) Indicator]- Crypto Academy /S4W8-Homework Post for professor @kouba01
Hello to all and sundry, it is of great pleasure to take part in this week’s crypto homework task with our noble professor @kouba01. This week is all about, Crypto Trading with Rate Of Change (ROC) Indicator

Question 1
In your own words, explain the ROC indicator with an example of how to calculate its value? And comment on the result obtained

In this chapter, I will be talking about what the ROC Indicator is all about. Like I said in my previous tax two weeks ago on “Trading with Chaikin Money Flow Indicator” in the professor tax, all indicators we have and have learned about I did mention that they are all mostly related to averaged-volumes and also their main purpose of creation is to indicate buy and sell signals in the crypto market.
The ROC also meaning Rate of Change is another type of indicator created as an unbounded momentum indicator that is employed in a technical analysis set based on a 0-midpoint line.
So basically, what we observe is that, when there is a rise in the ROC indicator above the 0-midpoint line, this will confirm an uptrend or a bullish trend in the market of the and as well as when we observe a fall of the ROC indicator below the 0-midpoint line, then it will typically confirm a bearish trend or a downtrend in the market.
This indicator is the good works of Konstantin Kopyrkin who brought the idea to life in the year 2001. This indicator like I said is a momentum-based technical indicator also having properties of measuring the %change in the price between current prices and also the price of a targeted number of periods ago. As I said, it is an indicator plotted against a zero midpoint. This indicator I mentioned in my introductory also measures price changes based on upwards and downwards trends.
Additionally, we can also use this technical indicator in finding or spotting divergence, either a bullish divergence or a bearish divergence trend in the market of a crypto asset. Also, we can use it in spotting overbought and oversold conditions, and lastly, centerline crossovers are another feature of this indicator.
Key Points About the ROC Indicator
The ROC indicator is an unbounded momentum indicator employed in technical analysis that is drawn from the 0-midpoint level.
ROC Indicator spotted going up above the 0-midpoint line confirms an uptrend or a bullish trend and the ROC Indicator when spotted going down the 0-midpoint line confirms a downtrend or a bearish trend.
In cases where prices are consolidating, then the ROC indicator hovers towards or near the 0 line
Let’s look at how the calculation of the ROC Indicator is done
We can use the formula stated below to do the calculation,
ROC = [current price – the price of N periods back] / price of N periods back * 100
Example
Assuming we were taxed to find the ROC of 9 periods of a crypto asset that had an initial price of $ 2,855 as its 9 periods back and now at a price of $3,000
We simply use the formula to do this calculation, which is:
SOLUTION
ROC = [current price – the price of N periods back] / price of N periods back * 100
ROC = [$3,000 - $2,855] / $2,855 * 100
ROC = 0.05079 * 100
ROC = 5.079%
Comments On Result
You can see that we have our ROC value to be 5.079% which is stating the price change of the asset from now price to the 9 periods ago or back price. The price at first was $2,855 and now at $3,000 and this is in the bullish direction. The price increased positively in an uptrend direction.

Question 2
Demonstrate how to add the indicator to the chart on a platform other than the tradingview, highlighting how to modify the settings of the period (best setting). (screenshot required)

In this chapter, I would be adding the ROC indicator to a crypto chart of my choice. I will also be explaining how to add the indicator to a chart in a systematic order and also how the settings are modified.
I would like to perform this task using the official website of Good crypto. It has versions like android and also the IOS. But I would be using the web version for this task.
The first thing I do is to visit the site through GoodCrypto. Once it loads, you then select the web app version to proceed.
The next stage is to select the trading side of it, this will give you access to the trading platform where we will be adding our indicator to the chart and making our modifications.
Proceed to select Fx which represents the indicators in the platform.
Search through the list of indicators and then select the ROCor Rate of Change Indicator

Below, you can see that our indicator has been added successfully to our chart.
Modifying the settings of CMF on Goodcrypto
To make any modifications, you will have to click on the indicator name and select the settings tab.
What to do next is, setting up the length which could also mean the period.
You can also make changes to the styling of the indicator. This involves the zero and plot of the indicator
Best ROC Indicator Settings
When using the ROC indicator, there are several and various settings that can be used. Thus, there is a common setting for this indicator which is the 9-periods but also, there are other commonly used settings that include the 14 and 25 periods as well. But the most important thing to traders is that they should know that there isn’t an absolute value or number that gives magically the right setting. There are volatilities in the market but what we should also know is that the wider the period sometimes reduces volatilities in the market.
As I have mentioned that there is not a specific setting that can also always give you the right settings, there is a need to always combine this indicator with other indicators to get the best result due to volatilities in the market. That is always the best way of trading, using more than a single indicator in making your technical analysis.

Question 3
What is the ROC trend confirmation strategy? And what are the signals that detect a trend reversal? (Screenshot required)

ROC Trend Confirmation Strategy
As I mentioned earlier, this indicator gives the %change between the price of assets. Thus, the ago price and the now price. This indicator confirms the trend with the help of the indicator 0-midpoint line. A cross above the 0-midpoint line upwards indicates an uptrend.
So, whenever we see that their line moves above the 0-midpoint line, it should tell us that the price of the asset is in the bull season. We should also take note of seeing the line going below the 0-midpoint line. This will indicate a bearish season when it goes below meaning we will see that the line will be heading towards the negative values of the 0-midpoint line. That is how the indicator confirms trends
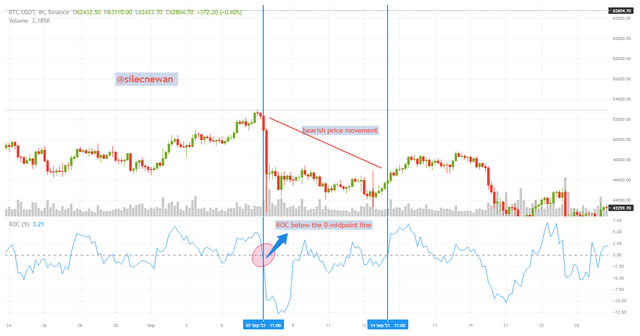
The below chart shows an uptrend. This is a chart of BTCUSDT on a 4hr time frame. You can see that the indicator confirms a bullish movement just right after the line went above the 0-midpoint line, this went towards the positive values indicating an uptrend in the price of the asset.

Also, in the below chart we can confirm a bearish trend movement. Again, a chart of BTCUSDT on a 4hr timeframe. We can confirm a downtrend just right after the line went below the 0-midpoint line downwards. This indicates that it went towards the negative values and this will be a downtrend in the price of the asset. So whenever it moves towards the negatives, then it means that there is a continuous bearish trend of the price of the asset.
Signals That Detects Trend Reversal with ROC Indicator
Trend reversals are mostly seen when the price hits either an oversold or an overbought region in the price of the asset. With the ROC Indicator. For instance, you will realize the ROC Indicator progressively moves lower and that means a bearish divergence from the price, this would signal a trend change but it would be in the downward direction.

Question 4
What is the indicator’s role in determining buy and sell decisions and identifying signals of overbought and oversold؟(screenshot required)

Buy and Sell Using ROC Indicator
When using the ROC Indicator to confirm a buy or a sell signal, it's very simple to know. This is because we do this by looking at the 0-midpoint line of the indicator.
So, for a buy signal, we observe the line to see if it moves above the 0-midpoint line. If there is a cross from below towards the positive values of the indicator, it would signal a buy order and so, traders can place their buys.

In the above chart, you can see that immediately the line of the indicator went above the 0-midpoint line, I suspected a buy signal and so I placed it and you can see that there was a bullish movement in the price of the asset.
In as much as we consider a buy when the line goes above the 0-midpoint line, we also confirm a sell signal when it seems to fall below the line. For the case of the indicator, it would move towards the negatives and it would signal a sell order in the price of the asset. So we consider a sell whenever the line of the indicator moves lower or below the 0-midpoint line.

In the above chart, just as I did for the case of the buy, here in the sell, you observe the line from moving below the 0-midpoint line. Once you see it going down and towards the negative values then it will signal a bearish movement in the price of the asset so you need to place your sell just as I did.
Using the ROC Indicator in Detecting Oversold and Overbought Cases.
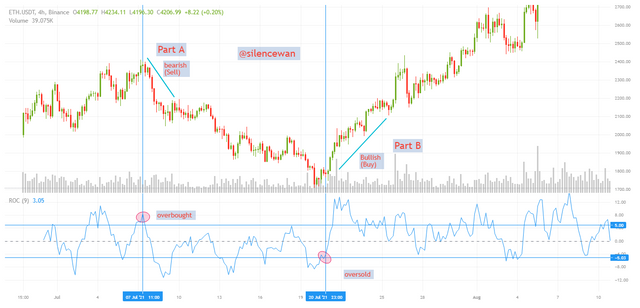
In our previous lesson with the professor, he stated what values to use in detecting the cases of oversold and overbought. But in this, he has not stated which gives us the chance to make a selection of ourselves. So I will be using +/- 5 to stand in as my support and resistance, the -5 as my support, and +5 as my resistance
So basically, what I am saying is that using these two values will help me detect an oversold and an overbought.

Part A (Overbought)
So, I was able to locate my overbought when the line of the indicator from above dropped below the +5 value. It moved above and a very sharp drop below the line was started as my resistance. This was how I was able to locate my overbought and as a matter of fact, it indicates a sell.
Part B (Oversold)
In this case, we will realize that the line of the indicator will fall below the -5 line and then a quick or sharp movement above the line again. That line indicates my support and so a sharp movement above it indicates an oversold and also indicates a buy signal. Let us confirm this in the chart below.

Question 5
How to trade with a divergence between the ROC and the price line? Does this trading strategy produce false signals? (screenshot required)

Divergence
Divergence has been discussed a quiet number of times whenever we learn about indicators. This is because it is very key to know as they signal early trend reversals. So traders should about the case in other not be in a heist to go into a trade.
Divergence occurs whenever the line of the indicator does not conform to that of the price of the asset. For instance, the line of the indicator could be moving in an upwards direction while the price of the asset is moving downwards. In this case, we can call it a bullish divergence. Let’s see the cases for all types of divergence.
Bullish Divergence of ROC Indicator
For a bullish divergence to occur as I mentioned earlier, you will observe that the line of the indicator is in a bullish move while the price of the asset is in a bearish move.
In the below chart, you will notice that where I marked signals the bullish move of the lie of the indicator, and also in the price, you can see that I place a line downwards. This is how a bullish movement occurs.
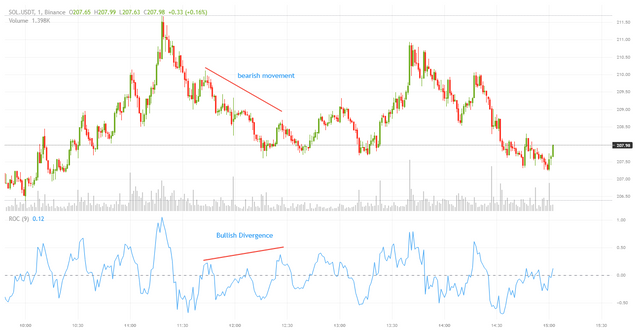
The above chart is a chart of SOL/USDT, we can confirm a Bullish divergence as the line of the indicator was found moving upwards while that of the price of the asset is going down. This doesn’t give the correlation that is supposed to exist between them, so we confirm a bullish divergence.
Bearish Divergence of ROC Indicator
In other to observe a bearish divergence, the line of the indictor is seen moving down while the price of the asset goes up. In this case, you see it moving line of the indicator moving lower than the previous one. This case is termed as a bearish divergence. So there is a need for some correlation to exist between the price of the asset and that of the line of the indicator.
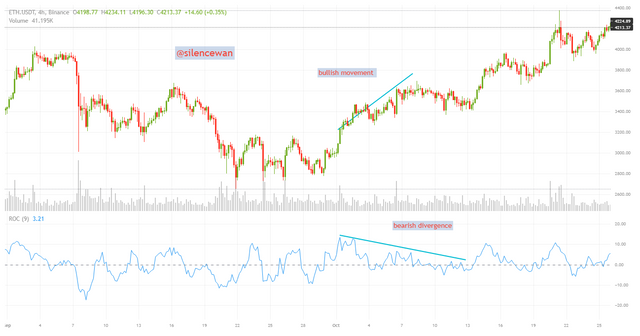
The above chart is an ETH/USDT chart. I was able to confirm a bearish divergence when I realized that the price of the asset gave a bullish movement while the ROC indicator moved differently confirming a bearish divergence.
False Signals of the ROC Indicator
Like I have always said, no indicator gives a 100% working ability. There are always lapses in every indicator. As we saw in the case of divergence, these are early trends that form and so they are false signals.
So the best way of trading is always to combine two or more indicators in use. For instance, using the ROC Indicator with EMA Indicator. This will at least help reduce some of the false signals we talking about.
Let's see the combination of the ROC Indicator and that of the EMA Indicator

The above chart is a chart that combines the ROC Indicator and that of the EMA Indicator.

Question 6
How to Identify and Confirm Breakouts using ROC indicator?(screenshot required)

ROC Indicator and Breakouts
To explain breakouts in the technical analysis, it refers to the case where the price of an asset seems to be moving above the resistance and also below a support area. So mostly, breakouts indicate that the price of the asset starts trending in the direction of the breakout.
What we should know is that we can either have a bullish breakout or a bearish breakout. This depends on how the breakout happens. See cases of breakouts in the price of an asset.
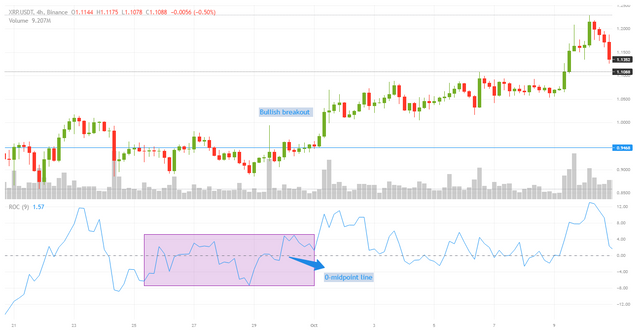
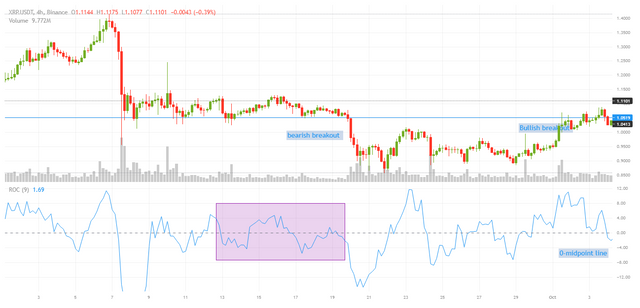
So as the line of the indicator moves up and below the 0-midpoint line, it causes a sideways movement of the price of the asset. The ROC Indicator confirms the breakout as the is a sharp movement either above or below the 0-midpoint line. When it is above, then we consider it as a bullish breakout and when it is below, we consider it as a bearish breakout.
Let's see some illustrations below.
A bullish Breakout
A bearish Breakout

Question 7
Review the chart of any crypto pair and present the various signals given by the ROC trading strategy. (Screenshot required)

In this tax, I will be performing a buy and a sell entry using the ROC trading strategy. We know how to read our buy signals, that is when we observe the line of the indicator moving above the 0-midpoint and also a sell signal when the indicator seems to fall below the 0-midpoint line. The divergence could also be another strategy but you need to be careful since they offer false signals. Another thing is also breakouts which we can also consider.
A- Buy Entry
I was able to place my buy entry with the help of the ROC Indicator and that of the EMA indicator.
I was able to confirm the buy entry as the line of the indicator wen above the 0-midpoint line and this was also confirmed by the EMA indicator. That is, the price of the asset went above the EMA indicator which also signaled a buy entry. I used the default period settings to avoid volatilities in the market.

So from the above chart of ETH/USD, I was able to place my buy entry signal as I did observe all the necessary indications. I used a risk-reward ratio of 1:1.
B- Sell Signal
Again, I will be placing a sell signal using the ROC Indicator alongside the EMA indicator with the default period settings of the ROC Indicator.
I was able to place a sell signal as I saw that, the line of the indicator went below the 0-midpoint line. We know that a drop below signals a sell. So, I was able to confirm this with the help of the EMA indicator as the price of the asset went below the line. This confirmed a sell signal.

Above is a chart of ETHUSD on which I placed my sell signal on. I was able to do this with the Help of the ROC and the EMA. I confirmed the Sell signal when the line of the indicator went below the 0-midpoint line and also got confirmed by the EMA as the price of the asset went below the EMA indicator. I placed my buy considering my stop loss and take profit as well with a risk-reward ratio of 1:1

Conclusion

I would like to extend my great regards to the professor for this week’s lecture. It was really interesting and has always been interesting doing your tax.
For the next two weeks' break, I surely will miss you.
The ROC Indicator just like all other indicators is a great one to use and it helps a lot in technical analysis.
But we should know that there is a need to always make a combination of indicators in your trades since we don’t have an indicator that gives 100% results.
Thanks to you professor @kouba01 for this wonderful work.
Thanks for reading…..!!!!!
Reference Links below. Sources of Charts are also below.
Lecture-Note
@silencewan
Reference-1
Reference-2
Goodcrypto
Tradingview


Hello @silencewan,
Thank you for participating in the 8th Week Crypto Course in its 4th season and for your efforts to complete the suggested tasks, you deserve a Total|7.5/10 rating, according to the following scale:
My review :
A good article in which you were able to answer most of the questions ably, and you have some notes that I made.
The most used periods correspond to ROCs at 12 and 25 for short and medium term trading. The ROC 12 is an excellent indicator of overbought / oversold in the short and medium term. The higher the ROC, the more the currency is overbought, the lower the ROC, the more likely a rally seems.
As for the third question, in its second half, you did not go into depth in determining how to reverse the trend using the indicator.
In the last question it was possible to extract several other signals.
Thanks again for your effort, and we look forward to reading your next work.
Sincerely,@kouba01
Thank you professor
I’m grateful for the review
Invest/Delegate your Steem Power and be assure of your daily income. Click here for more details.
Join our Discord Server & Community for more details