Analysis: Some estimates of Steem network degrees
Link to the github repository
https://github.com/steemit/steem
1.INTRODUCTION
Recently I have been interested in network analysis and I was examining the article Anatomy of Facebook where some parameters of the analysis of the Facebook network are discussed such as the cumulative degree distribution and the average degrees of separation.
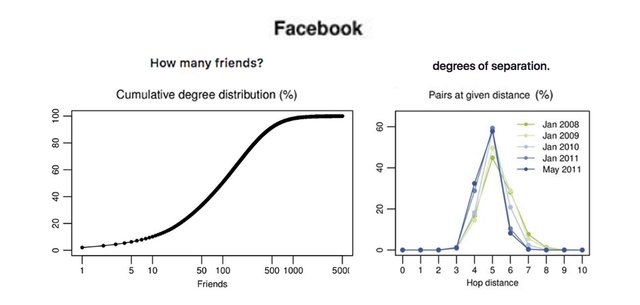
Cumulative degree distribution: An important basic view of any social network is the cumulative degree distribution, which shows the percentage of individuals that have less than a given number of friends. As you can see above, only 10% of people have less than 10 friends, 20% have less than 25 friends, while 50% (the median) have over 100 friends. Meanwhile, because the distribution is highly skewed, the average friend count is 190.
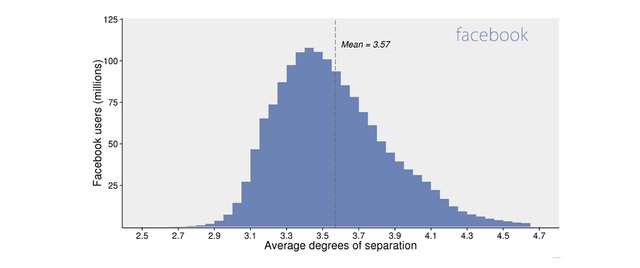
Average degrees of separation: The average distance in 2008 was 5.28 hops, in 2011 was 4.74 and in 2016 was 3.57
I was wondering if I could do a similar analysis for Steem and compare it with the known Facebook values. To understand this analysis you have to think of Steem as a network where the nodes are the accounts and the links between followers and followed are the edges that connect the nodes of the network.
The information needed can be taken from the FOLLOWERS view of SteemSQL
In first place I will show some results that I have obtained using KNIME (an estimate of the cumulative IN and OUT degree distribution) but when I tried to calculate the average degrees of separation I found the difficulty of doing it. Researching on network analysis I discovered the NETWORKX Library in Python that I have used to estimate the average degrees of separation and to improve / confirm the previous results calculated with KNIME.
It should be clear that my analysis represents only an approximation since the processing capacity required to make a deep analysis of the entire network exceeds my possibilities.
101 NETWORKS
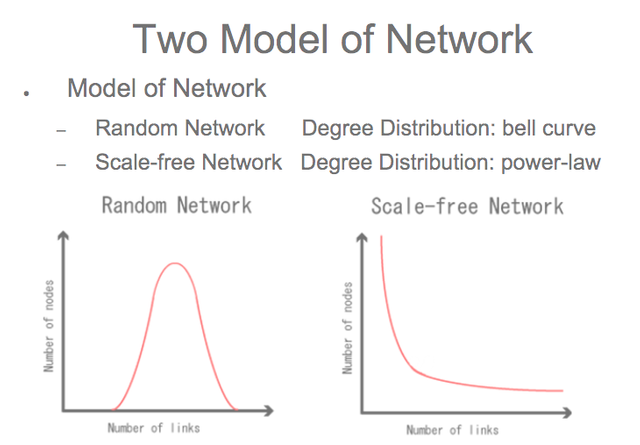
Random networks vs scale‐free networks. A network is composed of nodes n, linked together by edges. The main parameter of network analysis is the degree k of a node (or connectivity), that is, the number of nodes to which a given node is linked.
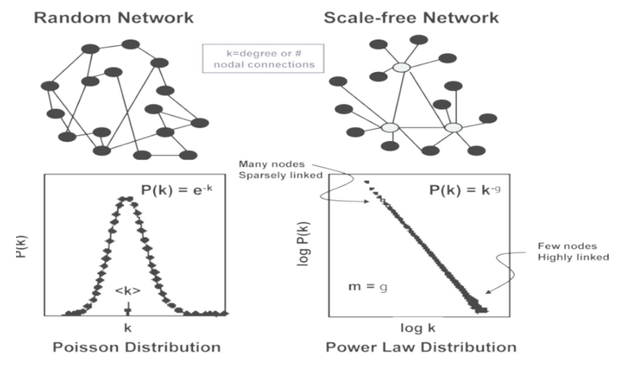
The connectivity of random networks (on the left) is characterized by a Poisson distribution, whereas a scale-‐free (or clustered) network (on the right) is defined by a power law distribution. As a result, in a scale-‐free network, most nodes are sparsely linked (black nodes) while a few nodes are highly linked and constitute hubs in the network.
2. ANALYSIS
THE FOLLOWERS VIEW
The size of this table is very large. It currently has 95,789,908 rows that represent the same number of edges between nodes or accounts.
- Each row has two fields: FOLLOWER and FOLLOWING
- If a specific order is not specified, the data comes with a certain pseudo-alphabetic order in the FOLLOWING column.
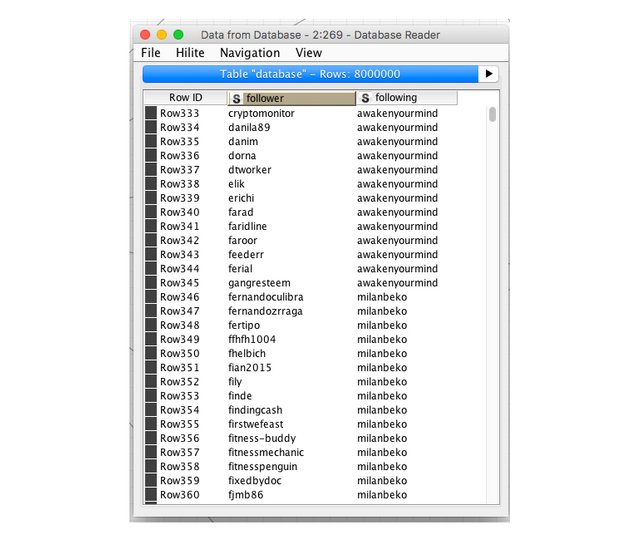
A subset of 8,000,000 (8M) edges
To avoid extracting the entire table and enabling calculations of the python Networkx library in a reasonable time with standard hardware, I extracted a subset of the Followers table consisting of 8M records to make the analysis.
2.1 ANALYSIS USING KNIME
FOLLOWER, FOLLOWED AND MIXED BEHAVIORS
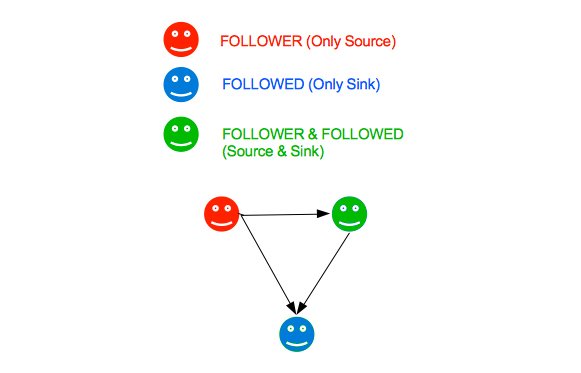
So, for this subset:
There are 226k unique nodes in the follower field and 77k unique nodes in the following field.
Some of these nodes or accounts are found in both fields as theses nodes have both types of behavior, follower and followed.
Seen in total, there are 274k unique accounts or nodes.
- 197K (72%) accounts or nodes with FOLLOWER behavior
- 48K (15.5%) accounts or nodes with FOLLOWED behavior
- 29K (10.5%) accounts or nodes with mixed behavior of FOLLOWER and FOLLOWED.
Proportions of behaviors
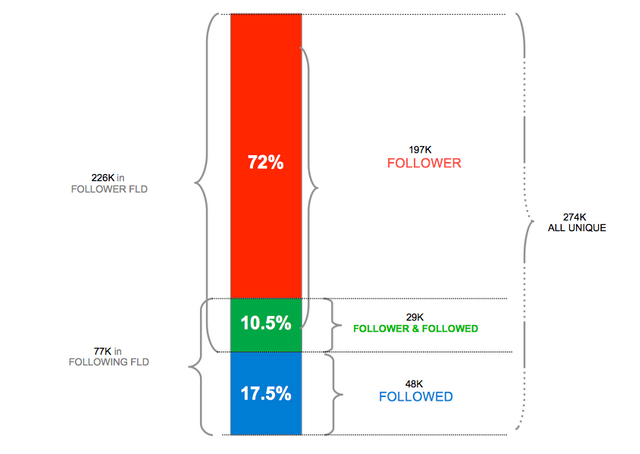
Expressing this data graphically in the form of a very simplified network, the following graph is obtained where it is appreciated that the behavior as a follower is the predominant one (72%) and the mixed behavior is the least (10.5%).
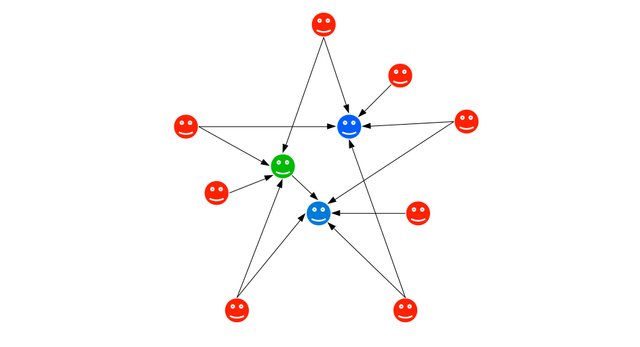
Let's analyze each behavior
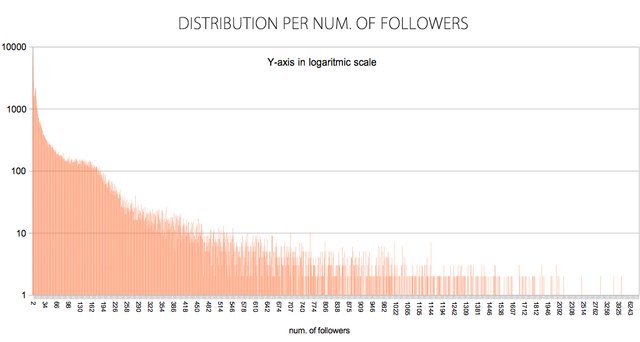
A) FOLLOWED BEHAVIOR (or counting the number of followers))
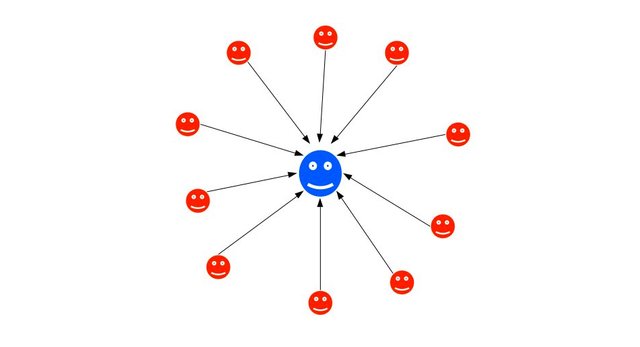
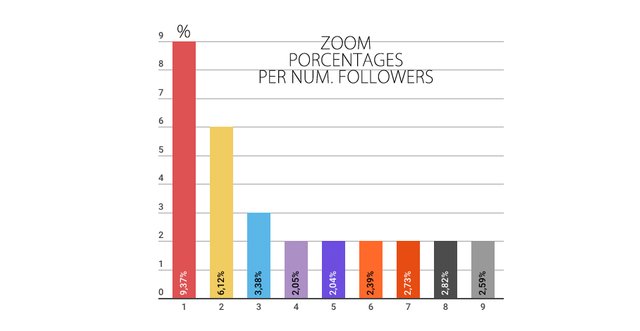
Grouping the data by the FOLLOWING field and counting the number of FOLLOWERS we obtain.
| NUM. FOLLOWERS | Number of nodes | % OF TOTAL |
|---|---|---|
| 1 | 7249 | 9.37% |
| 2 | 4736 | 6.12% |
| 3 | 2620 | 3.38% |
| 4 | 1586 | 2.05% |
| 5 | 1585 | 2.04% |
| 6 | 1856 | 2.39% |
| 7 | 2119 | 2.73% |
| 8 | 2183 | 2.82% |
| 9 | 2006 | 2.59% |
| =>10 | the rest | 66.51% |
Average and other statistics
- MEAN 103.44
- STD-DEV 301.95
- MAX. 25790
- MEDIAN 25
- VAR 91.17
Cumulative IN-degree (Num. followers) distribution
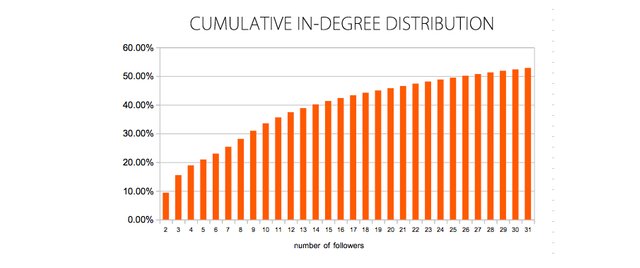
The cumulative In-degree distribution shows the percentage of nodes/accounts that have less than a given number of followers. As you can see above, 33% of nodes/accounts have less than 10 FOLLOWERS, 45% have less than 20 followers, while 50% (the median) have over 25 followers. Meanwhile, because the distribution is highly skewed, the average FOLLOWER count is 103.44
B) FOLLOWER BEHAVIOR (or counting the number of followed)
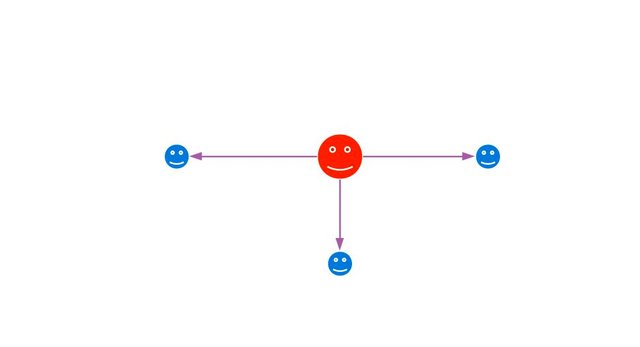
Grouping the data by the FOLLOWER field and counting the number of FOLLOWED we obtain.
| NUM. FOLLOWED | Number of nodes | % OF TOTAL |
|---|---|---|
| 1 | 81924 | 36.13% |
| 2 | 31762 | 14.01% |
| 3 | 17920 | 7.905% |
| 4 | 12031 | 5.30% |
| 5 | 8644 | 3.81% |
| 6 | 6551 | 2.88% |
| 7 | 5417 | 2.38% |
| 8 | 4499 | 1.98% |
| 9 | 3781 | 1.66% |
| =>10 | The rest | 23.90% |
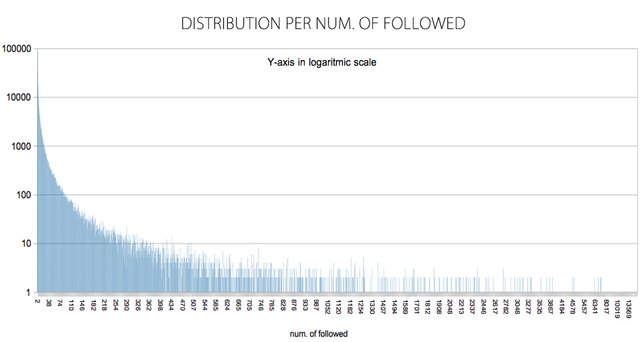
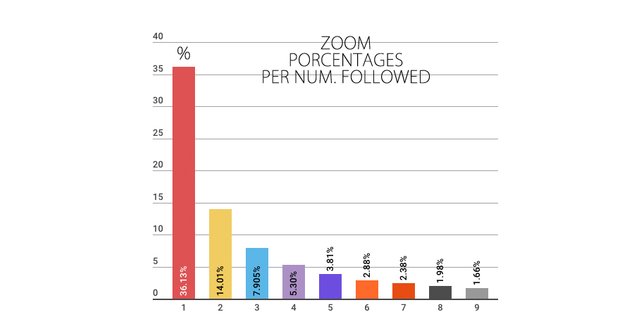
Average and other statistics
- MEAN 32.39
- STD-DEV 379.06
- MAX. 36403
- MEDIAN 3
- VAR 143.68
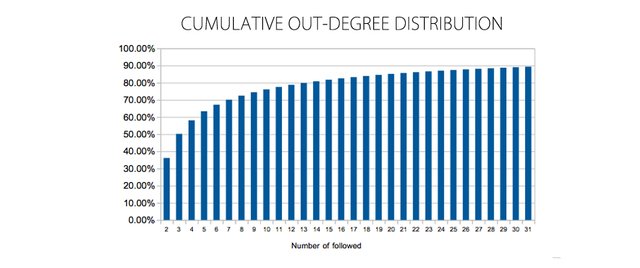
Cumulative OUT-degree (Num. followed) distribution
The cumulative Out-degree distribution shows the percentage of nodes/accounts that have less than a given number of followeed. As you can see above, 75% of nodes/accounts have less than 10 FOLLOWED, 84% have less than 20 followed, while 50% (the median) have over 3 followed. The average FOLLOWED count is 32.39
Comparing the two behaviors
These results confirm the expected different behavior (with respect to the number of edges) that the nodes have in a scale-free network.
A node/account with followed behavior has statistically three times as many edges as a node/account with follower behavior
This is very clear looking at the nodes that have only one follower (9%) and the nodes that have a single followed (36%)
But as we know, a node/account can have followers and followed at the same time, the total number of edges being the sum of both. In this way we can talk about a mixed behavior.
C) MIXED BEHAVIOR (or counting the number of friends)
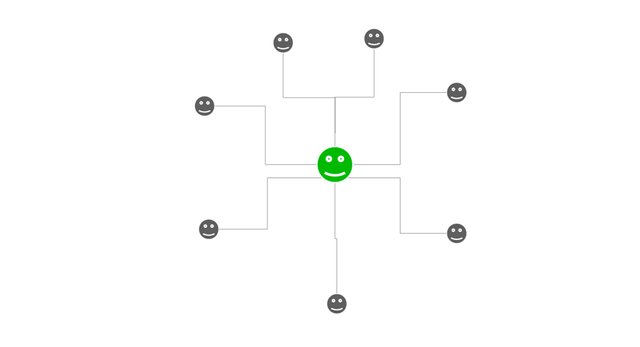
In this case, the variable to be measured must be the total number of edges, called the degree of the node that corresponds to the concept of number of "friends" or "contacts" in a social network.
To find the average behavior in terms of degree I will use later the power of the Networkx library, but here I expose an intuitive way of characterizing the mixed-behavior using the averages (and other statistics) previously found for the behaviors like followed and follower separately.
That idea can be schematized in this key phrase:
"The average of the mixed behavior is the average of the averages of the behaviors like follower and followed."
Seen numerically perhaps it is easier to understand:
(103 + 32) / 2 = 67.5
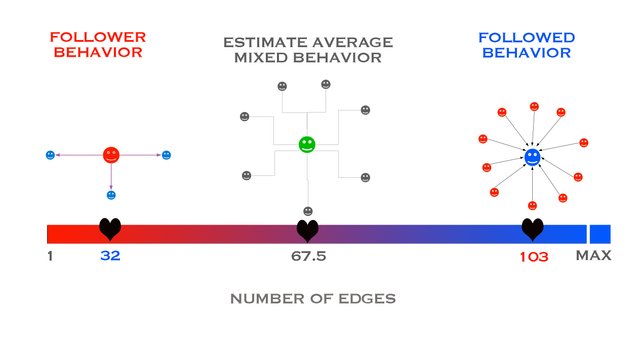
Finding the distribution of the mixed behavior from the distributions as follower or IN-DEGREE and as followed or OUT-DEGREE is not direct so I will obtain it later using the power of the Networkx library.
2.2 ANALYSIS USING NETWORKX
NetworkX is a Python package for the creation, manipulation, and study of the structure, dynamics, and functions of complex networks. NetworkX is free software released under the BSD-new license.
The performance of Networkx is incredible but when processing a large network (large number of nodes and edges) the need for advanced hardware is required to calculate some of the characteristics of the network. That is why I have created a subgroup of data with 8M edges.
READING THE EGDELIST OF A NETWORK
There are several ways to build a graph networkx "G" .One of them is to read a file in a certain format. Perhaps the easiest format that is the one I have used is the *** read_edgelist ***.
import networkx as nx
G = nx.read_edgelist ('edgelist_file.txt')
Where the file edgelist_file.txt consists of two columns, separated by a white space where the names of the nodes-accounts that form each edge or link are included.
follower1 followed0
follower2 followed0
follower3 followed0
.... etc
CALCULATING THE NUMBER OF NODES AND EDGES
Knowing the number of edges and nodes of the created networkS is easy and fast using:
nx.number_of_nodes (G)
nx.number_of_edges (G)
| SUBSET | NUMER OF EDGES | NUMBER OF NODES |
|---|---|---|
| G | 7,943,889 | 274,224 |
DRAWING NETWORKS
NetworkX provides basic functionality for visualizing graphs, ( its main goal is to enable graph analysis rather than perform graph visualization).
nx.draw (G)
plt.show ()
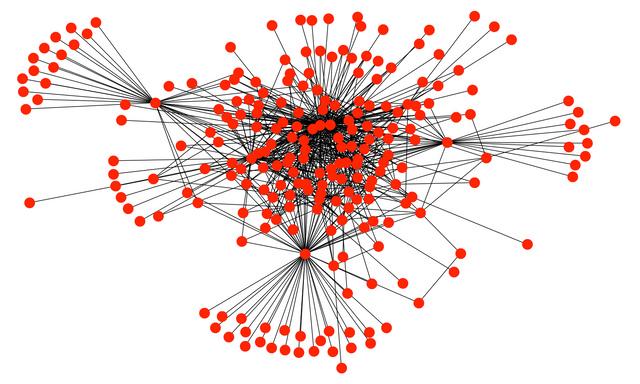
I have been able to apply the nx.draw (G) function to a SMALL group of edges and nodes but it is enough to give an idea of the structure of the network shown in the following figure.
DEGREES OF SEPARATION OF STEEM ECOSYSTEM
I have used two convergent ways to estimate this value. On the one hand, the AVERAGE SHORTEST PATH LENGTH as a lower value and the DIAMETER OF THE NETWORK as the higher value.
AVERAGE SHORTEST PATH LENGTH
Average path length is a concept in network topology that is defined as the average number of steps along the shortest paths for all possible pairs of network.
For connected graph
nx.average_shortest_path_length(G)
- I have obtained a value of 3.61
DIAMETER OF THE NETWORK
The diameter is the maximum eccentricity. The eccentricity of a node v is the maximum distance from v to all other nodes in G.
nx.diameter(G)
- Resulting a value of 6.
Then, the estimated final value for the DEGREE OF SEPARATION FOR THE STEEM ECOSYSTEM should be within that range [3.61 - 6]
Is this value valid considering the entire Steem ecosystem?
Adding more nodes of the network supposes in principle the possibility that the diameter of the network would grow but the edges of those new nodes added, according to what we know about the networks, would make the obtained value converges towards smaller values as has happened on Facebook in recent years. (4.74 in 2011 and 3.57 in 2016)
- Estimated average degrees of separation between all people on Facebook link .The average person is connected to every other person by an average of 3.57 steps. The majority of people have an average between 3 and 4 steps.
To know the real value for Steem we would need to do the calculations for the whole FOLLOWER view but I think the obtained value is coherent and reasonable.
Going back to the beginning
Returning to the analysis of the joint (In-Out) degree distribution and its average value that I initially estimated at 67.5 I will recalculate these results using the Networkx library using the corresponding concepts of the DEGREE DISTRIBUTION and the AVERAGE DEGREE CONNECTIVITY
AVERAGE DEGREE CONNECTIVITY
nx.average_degree_connectivity(G)
If we are analyzing an undirected and unweighted network, a node’s degree of connectivity will then simply be a summation of all the links that the node has.
- I have obtained a value of 57.93
- Comparing it with the first estimation of 67.5 we see that they are quite similar values and therefore the result seems coherent.
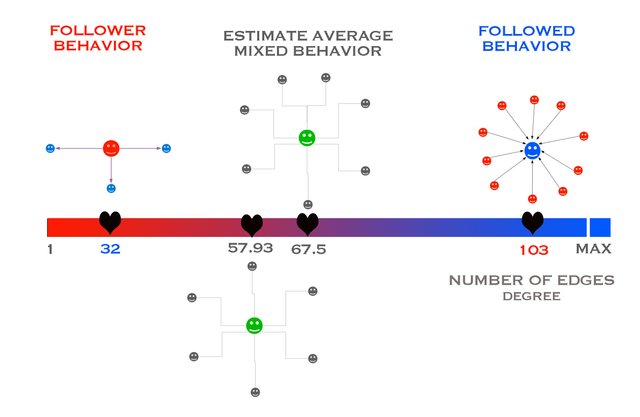
- The fact that it is a lower value (57.9 < 67.5) seems to indicate the greater number or weight of the nodes or accounts that have a follower behavior that have a lower number of edges or friends, or more formally, have a lower degree .
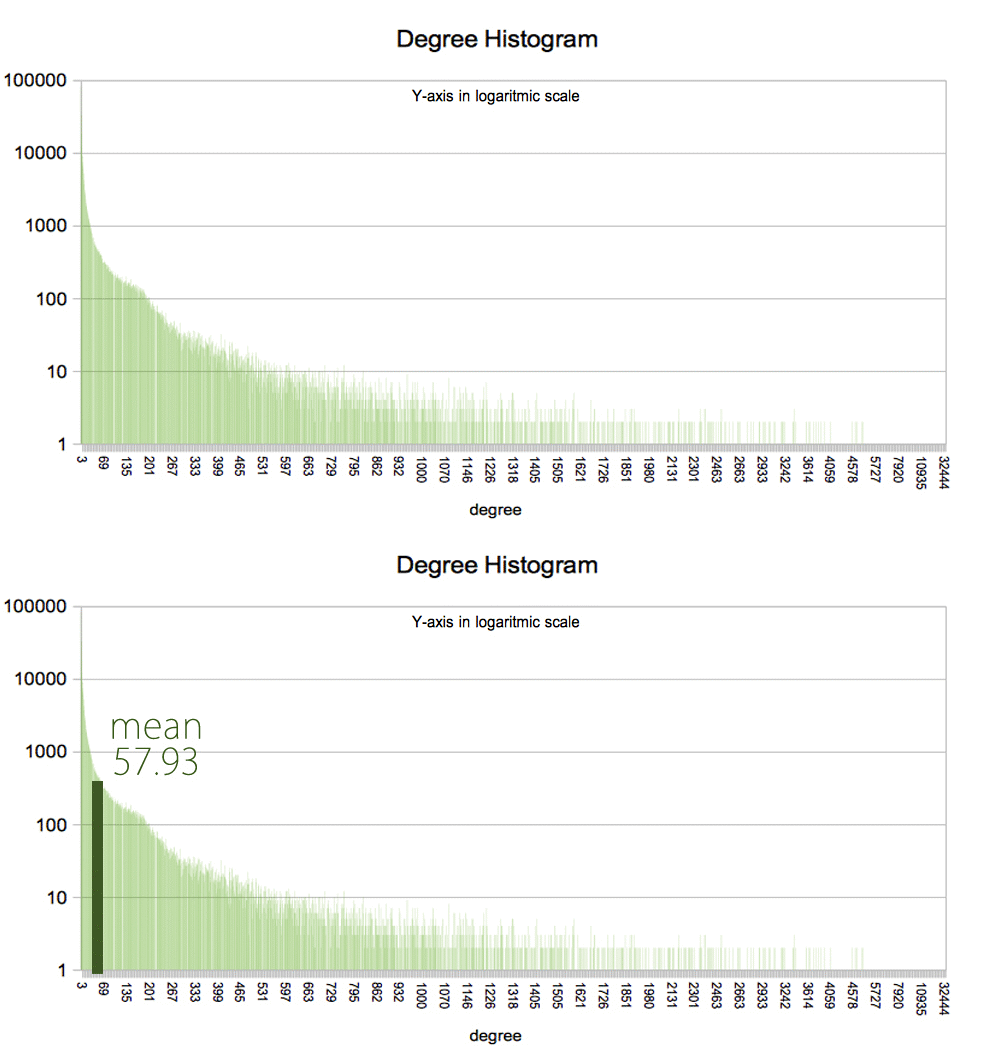
DEGREE DISTRIBUTION OF THE NETWORK
Calculating...
degree_sequence = sorted([d for n, d in G.degree()], reverse=True)  # degree sequence
degreeCount = collections.Counter(degree_sequence)
deg, cnt = zip(*degreeCount.items())
plt.bar(deg, cnt, width=0.90, color='b')
plt.title("Degree Histogram")
plt.ylabel("Count")
plt.xlabel("Degree")
.gif)
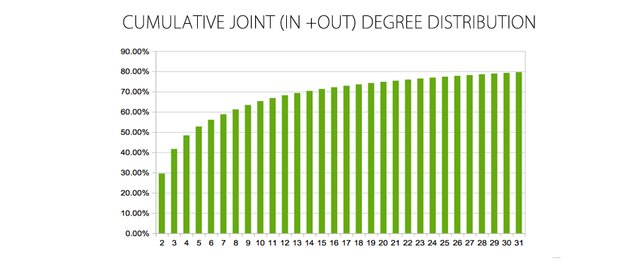
From the values of this distribution the Cumulative Degree Distribution is calculated
SOME RESULTS
- Percentage of accounts with less than 10 friends /(followers + followed) is over 65.31%
Percentage of accounts with less than 20 friends / (followers + followed) is over 74.88%
50% of Steemit accounts have over 4-5 friends
NOTE:
It is necessary to understand that the subgroup of data used introduce different"effects" to the results: (1) Only accounts that have at least one friend (follower or follower) are being used, that is, those that do not have any friends are not included) (2) Only 8M edges of the existing 95M have been used. (3) The FOLLOWERS view is ordered by the following field, that is, it includes all the followers of a followed, but not necessarily all of the followed for a follower.
This last result of 4-5 friends (grade or number of edges or links) for 50% of Steem's accounts may seem surprisingly low. Maybe the real value (calculated using all 95M edges) is something different and possibly higher but not too far from the one obtained. If you examine your own number of friends (In+Out) this will be much higher than 4-5 but on the other hand there are a lot of accounts with very few links: 1 (29.5%), 2 (12.1%), 3 (6.7%), etc.
3. DATA SOURCE, DATES, SQL QUERY and TOOLS
DATA SOURCE
I have used SteemSQL, a publicly available Microsoft SQL database containing all the Steem blockchain data held and managed by @arcange.
DATES
- Data extraction 2018-08-18
- Submitting date 2018-09-24
SQL MAIN QUERY
SELECT top 8000000   *
FROM Followers
ANALYSIS TOOL
I have used KNIME, a free and open-source data analytics, reporting and integration platform, to get, filter and manipulated data
KNIME WORKFLOW

SPIDER
The Scientific PYthon Development EnviRonment
NetworkX
A Python library for studying graphs and networks.
Hi @sintoniz, wow, again an impressive analysis! I'm proposing this as a staff pick. However, but due to the recent HF and the VP-to-Mana change, we still can't guarantee an utopian vote at all :(
Thanks for the pointer to the NetworkX library! I didn't know about it and it looks really great!
I think using 8M accounts is a reasonable subset that allowed you to draw meaningful conclusions, and I assume that this already took quite some time to process!
I think this is actually a quite high number and IMO a pretty good result for Steem (and I'm aware of the note on this statement). Correlating these results with a metric to classify accounts as active/inactive could make an interesting follow-up analysis!
Your contribution has been evaluated according to Utopian policies and guidelines, as well as a predefined set of questions pertaining to the category.
To view those questions and the relevant answers related to your post, click here.
Need help? Write a ticket on https://support.utopian.io/.
Chat with us on Discord.
[utopian-moderator]
Thanks @crokkon
Yes, the statistical parameters for power law distributions, such as the median and the mean are always disconcerting since, in a certain way, they conceal the great polarity between highly differentiated polar behaviors, perhaps their utility is maximized when we observe their evolution over time or with the variation of some variable, or as you say, with the correlation with other parameters.
Enjoy NetworkX!
I was not aware of the HF. This is a wild territory of continuous surprises!
Thank you for your review, @crokkon!
So far this week you've reviewed 2 contributions. Keep up the good work!
Hello @sintoniz, we do apologize for the inconvenience of your contribution not receiving an Utopian upvote on time. This was due to the recent hard fork (HF20) on the Steem blockchain. Although utopian upvotes are not guaranteed, we however, find your contribution valuable and believe that it ought to be rewarded as they appear on the list of Utopian staff picks. This comment is to notify you that you should leave a comment replying to mine to receive the missed reward from Utopian. You are advised to do this on or before Thursday (5th October 2018). We appreciate your patience and we hope to see more of your awesome contribution to open source projects.
Thank you.
Hello @knowledges,
Ok, I understand and appreciate your kindness.