Steemit Crypto Academy Season 3 Week 2 - Beginner's Course | Introduction to Charts for @reminiscence01
This is another wonderful week in the steemit crypto academy. This lessons had been helping us a lot and here we are again this week. This is my attempt to the homework of @reminiscence01 in the cryptoacademy Season 3 week 2.
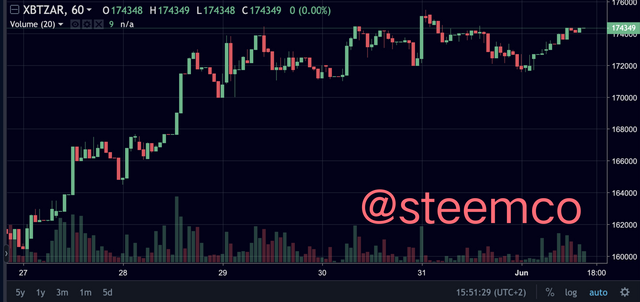
Question 1: Explain the Japanese Candlestick Chart? (Chart screenshot required)
A Japanese candlestick is a price diagram that shows low- and high sale prices for every period for the starting, closing or closure. It was invented by Japanese rice dealers centuries ago and popularized by a broker named Steve Nison in the 1990s among western traders.
In particular with technical traders, Japanese candlestics charts are the most popular way to analyze price action quickly. Visually they provide much more information that the traditional line charts.
Japanese Candlesticks are an instrument for the technical analysis used by traders for the analysis and graph of cryptocurrency price movement. Munehisa Homma, a Japanese rice trader, developed the concept of candlestick charting. Homma has found that during routine trading, the market for rice has been influenced by traders' emotions, while recognizing the effects of rice demand and supplying.
The structure of the candle stick
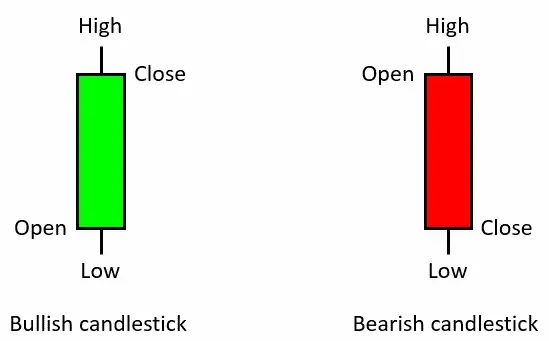
The body and two wicks are a candlestick. The candlestick body is drawn as a rectangle that marks the time of opening and ending. The opening in a bull candle is shown by the rectangle bottom while the closing is marked by the rectangle top. On the other hand, in a bear's candle, the close price of the period falls below the starting price of the period. One important advantage is that the body of the candlestick may appear in color. This enables a trader to rapidly get an idea whether the price is controlled by buyers or sellers.
.png)
Image source
Market price movement is graphically represented by candlesticks. A bullish market sentiment is represented by A bull candle which is represented by green candle. Bearish market sentiment is indicated by a close below the open, A red candle is used to represent this, and it is known as a bear candle.

DESCRIBE ANY OTHER TWO TYPES OF
CHARTS?
Other types of charts are:
Bar Charts
A bar chart is a series of price bars, all representing price movement over a specific time period. A vertical line runs through each bar, indicating the highest and lowest price attained as at the period. A little horizontal line on the left of the vertical line indicates the opening price, and a tiny horizontal line on the right indicates the closing price.
.jpeg)
The bar may be painted black or green if the closing price is higher than the open price. If the closing price is lower than the open, it means the price fell during as at the time period, and the chart may be colored red. Traders can better see patterns and trends of price changes because of the color codingin the bars.
Long vertical bars indicate a significant price differential between the period's high and low. That suggests that throughout that time, volatility increased. There was less volatility when a bar had relatively small vertical bars.
Line chart:
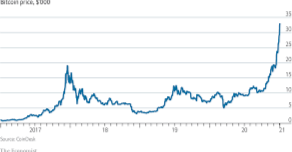
A line chart is a type of an asset's graph presentation that makes use of continuous line to connect a sequence of data points. This has been the most basic sort of chart in finance, and it usually merely shows the closing prices of a securities over time. Line charts can be used for any timescale, however they are most commonly employed to show daily price fluctuations.
A line chart shows traders exactly where the price of a securities has moved over time. Line charts remove noise from less critical moments in the trade day, such as the open, high, and low prices, because they only show closing prices. Because closing prices are a frequently viewed piece of data related to a security, line charts are popular among investors and traders.
Question 3: In your own words, explain why the Japanese Candlestick chart is mostly used by traders.
There are various reasons why traders may prefer the candlestick chart to other charts among which are:
Many traders prefer candlestick charts to standard bar charts because they are more aesthetically pleasing and easier to understand. Each candlestick depicts price activity in a straightforward, aesthetically appealing manner, allowing traders to compare the relationship between both the opening and close, as well as the high and low, in real time.
Another reason is that japanese candle stick is better than the other chart. Why did I say that; we can see that Line charts simply display closing prices, whereas bar charts are more difficult to comprehend. Candlesticks, on the other hand, are simple to use and display OHLC data. They are rather straightforward to learn.
Question 4: Describe a bullish candle and a bearish candle identifying its anatomy? (Screenshot is required)
Image source
These candlesticks can be a bullish one or a bearish one. Bullish simply indicates that the price rises over time, whereas bearish means that the price falls over period. The two basic candlesticks are bullish and bearish. When the close of a candle exceeds the open, it is considered bullish. When the close of a candle is lower than the open, it is called bearish.
Emotion is typically a driving force in trading, which can be seen in candlestick charts. Each of these candles is unique, with the green candle indicating an increase in price and the red candle indicating a reduction in price over time. Traders can utilize individual candlesticks to determine significant support and resistance levels by looking for patterns.
Conclusion
Candlestick charts are frequently used to make investing and trading choices, as well as to make revisions to such decisions in some circumstances. Opening a new trade, terminating a current one, or scaling out of a trade to obtain partial profits are all examples of trading decisions.
Before you begin trading, you should familiarize yourself with the fundamentals of candlesticks. To master candlestick patterns, you'll need to study charts on a regular basis. Candlestick analysis, like anything else, takes time to perfect. Above all, you must comprehend the psychology underlying these candlestick formations.
Hello @steemco , I’m glad you participated in the 2nd week of the Beginner’s class at the Steemit Crypto Academy. Your grades in this task are as follows:
Recommendation / Feedback:
Your work is similar to every other work i have reviewed and i can say that you got your ideas from other posts and changed the structure. Please spend time to understand the lesson and write in your own words.
Thank you for submitting your homework task.